Mapping Mangrove Distribution Based on AMMI (Suyarso & Avianto, 2022)
Using Geemap (Wu, 2020) and Cartoee (Markert, 2019) Layout
Overview This analysis demonstrates the application of the Automatic Mangrove Map and Index (AMMI) algorithm using Python-based geospatial tools to monitor mangrove ecosystems.
Tools and Libraries
ee (Earth Engine API)
The core interface used to access Google Earth Engine’s cloud-based geospatial datasets and high-performance computing power.geemap & geemap.cartoee
Used to visualize GEE layers.cartoeespecifically allows the creation of publication-quality static maps by integrating Earth Engine data with thematplotlibplotting environment.matplotlib & cartopy
matplotlibhandles the overall figure layout, whilecartopyprovides tools for map projections, coordinate reference systems (CRS), and gridline generation.
AMMI Index (Automatic Mangrove Map and Index)
The Automatic Mangrove Map and Index (AMMI) is a specialized vegetation index designed to:
Identify mangrove extents automatically
Estimate canopy density
Unlike general vegetation indices, AMMI is optimized to distinguish mangroves from other coastal features.
Developed By
Suyarso and P. Avianto (2022)
Research Center for Oceanography, National Research and Innovation Agency (BRIN, formerly LIPI), Indonesia.
Algorithm and Thresholding
The AMMI formula is derived from reflectance values () of:
NIR (Near Infrared)
SWIR1 (Shortwave Infrared 1)
Red band
1. Land Delineation
This component strengthens terrestrial signals while suppressing water and marine features.
2. Mangrove classification
This part is calibrated to capture mangrove extent and canopy density.
3. Complete AMMI Formula
Classification Thresholds
Mangrove Binary Map
→ Classified as mangroveMangrove Density Index
→ Used to visualize canopy density variation
Prepared By
Defani Arman Alfitriansyah
Faculty of Forestry, Universitas Kuningan
Install Library
#!pip install ee
#!pip install geemap
#!pip install cartopy
Code
import ee
import geemap.cartoee as cartoee
import matplotlib.pyplot as plt
import cartopy.crs as ccrs
import matplotlib.colors as mcolors
import matplotlib.cm as cm
from matplotlib.patches import Patch

#GEOAXES PREPARATION IN CARTOEE
from cartopy.mpl.geoaxes import GeoAxes
from cartopy.mpl.gridliner import LONGITUDE_FORMATTER, LATITUDE_FORMATTER

cartoee.GeoAxes = cartoee.GeoAxesSubplot = GeoAxes
cartoee.ccrs = ccrs
cartoee.LONGITUDE_FORMATTER = LONGITUDE_FORMATTER
cartoee.LATITUDE_FORMATTER = LATITUDE_FORMATTER

# INITIALIZE EARTH ENGINE
ee.Authenticate()
ee.Initialize(project='ee-defaniarman')

# DEFINE REGION OF INTEREST FROM ASSET
batas_wilayah = ee.FeatureCollection(
    "projects/ee-defaniarman/assets/areakajian"
)

# LOAD CLOUD SCORE PLUS COLLECTION
csPlus = ee.ImageCollection(
    'GOOGLE/CLOUD_SCORE_PLUS/V1/S2_HARMONIZED'
)

# FUNCTION TO APPLY CLOUD SCORE PLUS MASK
def maskS2CSPlus(image):
    qa = image.select('cs_cdf')
    return image.updateMask(qa.gte(0.60))

# BASE SENTINEL-2 COLLECTION
s2_base = (ee.ImageCollection('COPERNICUS/S2_SR_HARMONIZED')
    .filterBounds(batas_wilayah)
    .filterDate('2024-01-01', '2025-12-01')
    .filter(ee.Filter.lt('CLOUDY_PIXEL_PERCENTAGE', 20))
)

# FUNCTION TO SCALE REFLECTANCE
def scale_image(img):
    return img.multiply(0.0001).copyProperties(
        img, ['system:time_start']
    )

# APPLY MASKING AND CREATE MEDIAN COMPOSITE
s2_masked = (s2_base
    .linkCollection(csPlus, ['cs_cdf'])
    .map(maskS2CSPlus)
    .map(scale_image)
)

s2 = s2_masked.median().clip(batas_wilayah)

# SELECT BANDS FOR AMMI CALCULATION
RED   = s2.select('B4')
NIR   = s2.select('B8A')
SWIR1 = s2.select('B11')

# CALCULATE AMMI INDEX
AMMI = s2.expression(
    '((NIR - RED) / (RED + SWIR1)) * '
    '((NIR - SWIR1) / (SWIR1 - (0.65 * RED)))',
    {
        'NIR': NIR,
        'RED': RED,
        'SWIR1': SWIR1
    }
).rename('AMMI')

# THRESHOLD FOR BINARY AND DENSITY MANGROVE
AMMI_ts = AMMI.gt(6).selfMask().rename('AMMI_binary')
AMMI_density = AMMI.updateMask(AMMI.gt(5)).rename('AMMI_density')

# VISUALIZATION PARAMETERS
colors_ammi = ['#0000FF', '#00FFFF', '#FFFF00', '#008000']
ammiVis = {'min': 5, 'max': 25, 'palette': colors_ammi}
fcVis = {'bands': ['B8A', 'B11', 'B4'], 'min': 0, 'max': 0.3}
binVis = {'palette': ['#008000']}

# PREPARE MANUAL MATPLOTLIB COLORBAR
cmap_ammi = mcolors.LinearSegmentedColormap.from_list(
    'ammi_cmap', colors_ammi
)
norm_ammi = mcolors.Normalize(vmin=5, vmax=25)
mappable_ammi = cm.ScalarMappable(norm=norm_ammi, cmap=cmap_ammi)
mappable_ammi.set_array([])

# GET BOUNDING BOX FOR CARTOEE REGION
bbox = batas_wilayah.geometry().bounds().getInfo()['coordinates'][0]
region = [
    min(x[0] for x in bbox),
    min(y[1] for y in bbox),
    max(x[0] for x in bbox),
    max(y[1] for y in bbox)
]

# CREATE 2X2 FIGURE WITH UNIFORM PLOT SIZES
fig, axs = plt.subplots(
    2, 2, figsize=(15, 15),
    subplot_kw={'projection': ccrs.PlateCarree()},
    layout='constrained'
)

# ADD LETTER IN CIRCLE (TOP LEFT)
def add_letter(ax, letter):
    ax.annotate(
        letter, xy=(0.05, 0.95), xycoords='axes fraction',
        bbox=dict(boxstyle="circle,pad=0.3", fc="white", ec="black", lw=1),
        ha='center', va='center', fontsize=14, zorder=100, weight='bold'
    )

# PLOT 1: FALSE COLOR
cartoee.add_layer(axs[0, 0], s2, region=region, vis_params=fcVis)
cartoee.add_gridlines(axs[0, 0], interval=0.1, linestyle=":")
axs[0, 0].set_title('False Color (B8A/B11/B4)', fontsize=14)
add_letter(axs[0, 0], 'a')

# PLOT 2: AMMI RAW
cartoee.add_layer(axs[0, 1], AMMI, region=region, vis_params=ammiVis)
cartoee.add_gridlines(axs[0, 1], interval=0.1, linestyle=":")
axs[0, 1].set_title('AMMI Raw', fontsize=14)
add_letter(axs[0, 1], 'b')
cbar1 = fig.colorbar(
    mappable_ammi, ax=axs[0, 1], orientation='vertical',
    shrink=0.8, pad=0.03
)
cbar1.set_label("AMMI Value")

# PLOT 3: AMMI DENSITY
cartoee.add_layer(
    axs[1, 0], AMMI_density, region=region, vis_params=ammiVis
)
cartoee.add_gridlines(axs[1, 0], interval=0.1, linestyle=":")
axs[1, 0].set_title('Mangrove Density (>5)', fontsize=14)
add_letter(axs[1, 0], 'c')
cbar2 = fig.colorbar(
    mappable_ammi, ax=axs[1, 0], orientation='vertical',
    shrink=0.8, pad=0.03
)
cbar2.set_label("AMMI Density Index")

# PLOT 4: AMMI BINARY
cartoee.add_layer(axs[1, 1], AMMI_ts, region=region, vis_params=binVis)
cartoee.add_gridlines(axs[1, 1], interval=0.1, linestyle=":")
axs[1, 1].set_title('Mangrove Binary (>6)', fontsize=14)
add_letter(axs[1, 1], 'd')

# ADD LEGEND TO THE TOP RIGHT BOX OF PLOT 4
legend_elements = [
    Patch(facecolor='#008000', edgecolor='black', label='Mangrove'),
    Patch(facecolor='#FFFFFF', edgecolor='black', label='Non-Mangrove')
]
axs[1, 1].legend(
    handles=legend_elements, loc='upper right',
    frameon=True, fontsize=12
)

# SHOW FINAL PLOT
plt.show()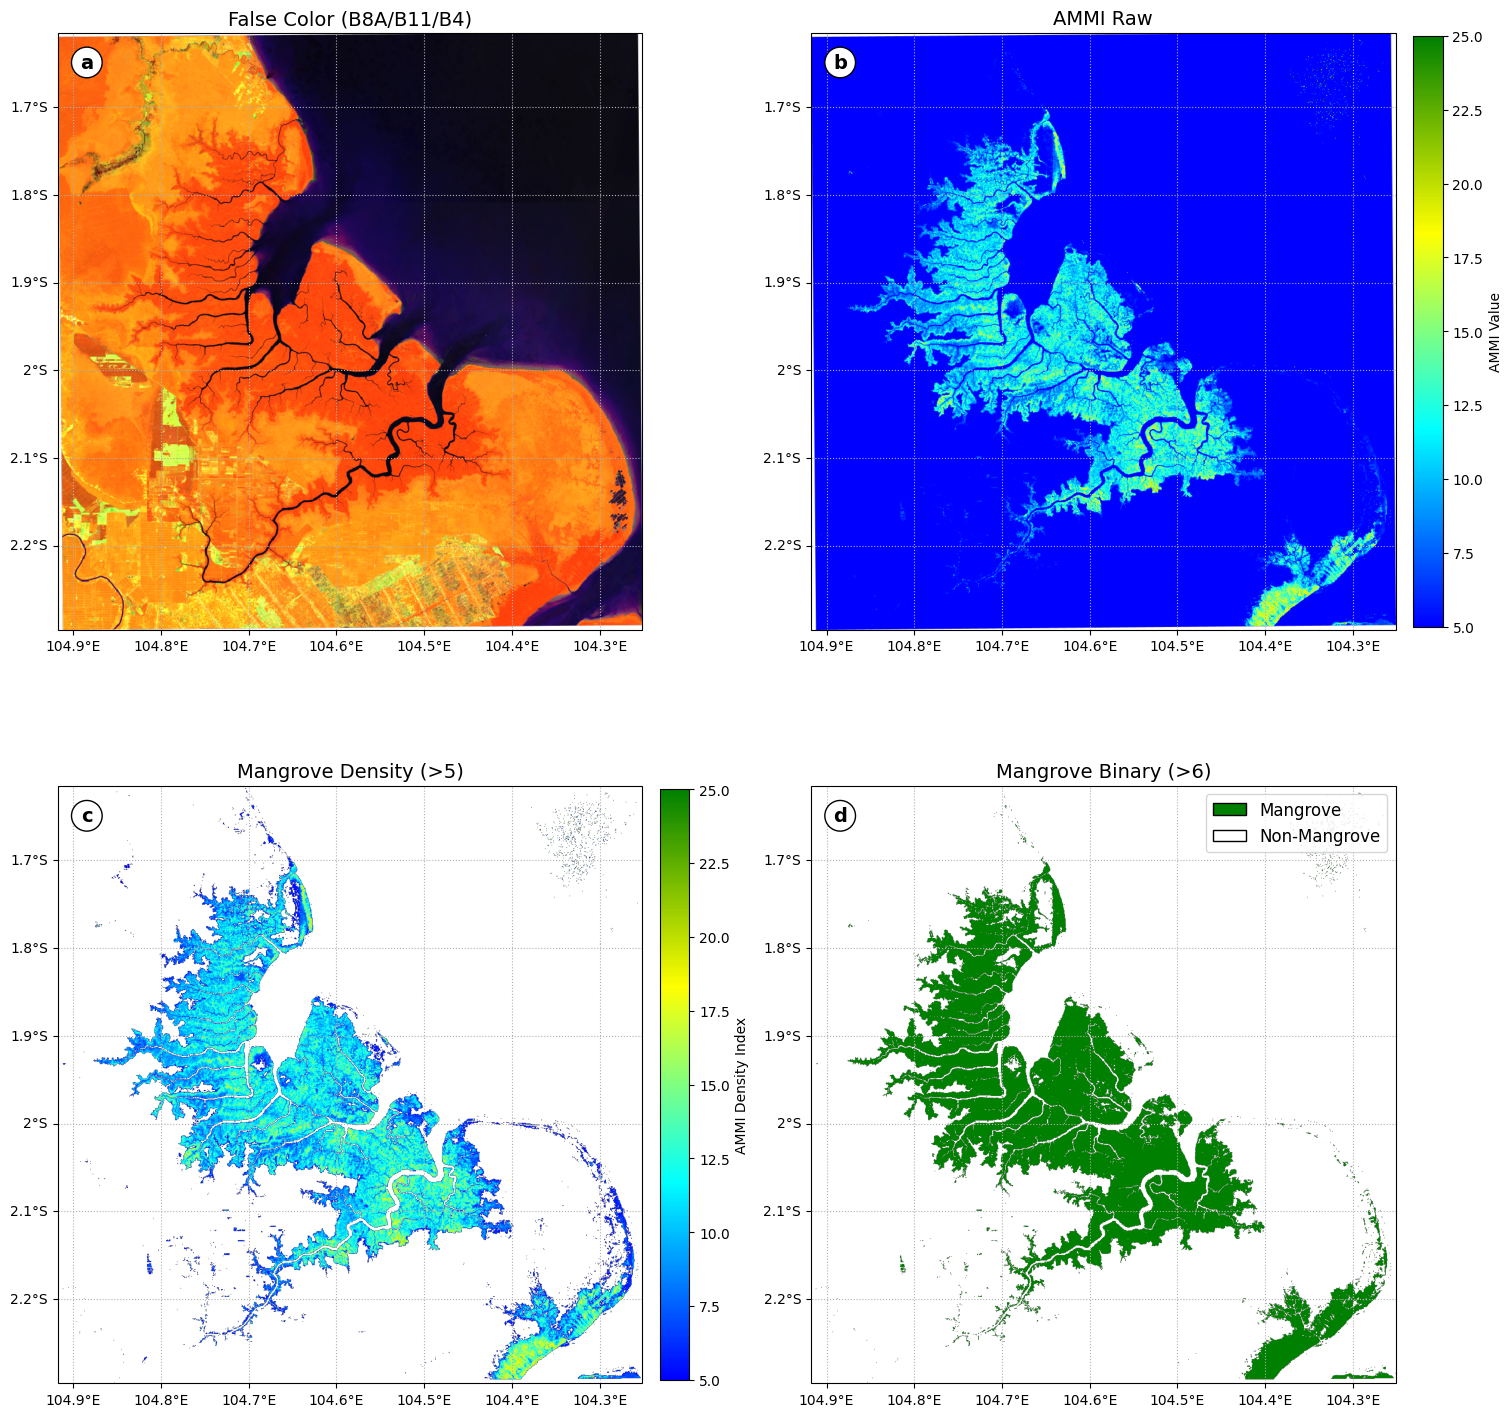
References
[1] Gorelick, N., Hancher, M., Dixon, M., Ilyushchenko, S., Thau, D., & Moore, R. (2017). Google Earth Engine: Planetary-scale geospatial analysis for everyone. Remote Sensing of Environment, 202, 18–27. Gorelick et al. (2017)
[2] Hunter, J. D. (2007). Matplotlib: A 2D graphics environment. Computing in Science & Engineering, 9(3), 90–95. Hunter (2007)
[3] Markert, K. (2019). Cartoee: Publication quality maps using Earth Engine. Journal of Open Source Software, 4(33), 1207. Markert (2019)
[4] Met Office. (2015).
Cartopy: A cartographic python library with a matplotlib interface.
http://
[5] Suyarso. (2022). AMMI Automatic Mangrove Map and Index: An analytical study on satellite imageries at Aru Islands, Maluku, Indonesia. In Emerging Challenges in Environment and Earth Science (Vol. 2, pp. 107–130). BP International. . (2022)
[6] Suyarso, & Avianto, P. (2022). AMMI Automatic Mangrove Map and Index: Novelty for efficiently monitoring mangrove changes with the case study in Musi Delta, South Sumatra, Indonesia. International Journal of Forestry Research, 2022, 1–13. Suyarso & Avianto (2022)
[7] Wu, Q. (2020). Geemap: A Python package for interactive mapping with Google Earth Engine. Journal of Open Source Software, 5(51), 2305. Wu (2020)
- Gorelick, N., Hancher, M., Dixon, M., Ilyushchenko, S., Thau, D., & Moore, R. (2017). Google Earth Engine: Planetary-scale geospatial analysis for everyone. Remote Sensing of Environment, 202, 18–27. 10.1016/j.rse.2017.06.031
- Hunter, J. D. (2007). Matplotlib: A 2D Graphics Environment. Computing in Science & Engineering, 9(3), 90–95. 10.1109/mcse.2007.55
- Markert, K. (2019). cartoee: Publication quality maps using Earth Engine. Journal of Open Source Software, 4(33), 1207. 10.21105/joss.01207
- . S. (2022). AMMI Automatic Mangrove Map and Index: An Analytical Study on Satellite Imageries at Aru Islands, Maluku, Indonesia. In Emerging Challenges in Environment and Earth Science Vol. 2 (pp. 106–130). Book Publisher International (a part of SCIENCEDOMAIN International). 10.9734/bpi/ecees/v2/3423e
- Suyarso, & Avianto, P. (2022). AMMI Automatic Mangrove Map and Index: Novelty for Efficiently Monitoring Mangrove Changes with the Case Study in Musi Delta, South Sumatra, Indonesia. International Journal of Forestry Research, 2022, 1–14. 10.1155/2022/8103242
- Wu, Q. (2020). geemap: A Python package for interactive mapping with Google Earth Engine. Journal of Open Source Software, 5(51), 2305. 10.21105/joss.02305