29 March 2025 · Terbit pertama di Medium · Semua tulisan
I am currently learning remote sensing and experimenting with different approaches for land cover analysis. In this exploration, I used Sentinel-2 imagery to distinguish mangroves based on their spectral characteristics.
Step 1: Acquiring Sentinel-2 Imagery
First, I obtained Sentinel-2 imagery from the Copernicus Open Access Hub. The selected image covers the area of interest during a season with minimal cloud cover to ensure high-quality data.
Step 2: Applying Band Composition
To enhance mangrove visibility, I applied an 8–11–4 composite (NIR-SWIR-Red).
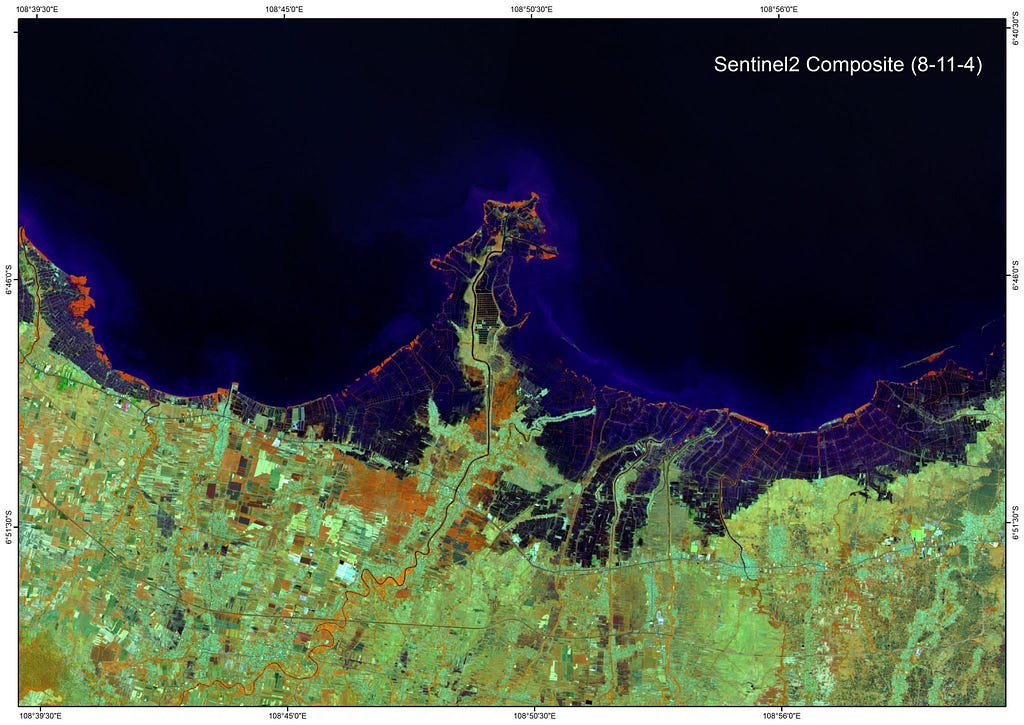
Band 8 (NIR) highlights vegetation. Band 11 (SWIR) differentiates moisture content. Band 4 (Red) helps detect vegetation stress. In this composite, mangroves appear orange, but with varying brightness levels. This spectral difference provided a way to separate mangroves from other vegetation.
Step 3: Calculating Spectral Indices
To further enhance the distinction of mangroves, I calculated two key indices using the following formulas:
NDMI (Normalized Difference Moisture Index):
The Normalized Difference Moisture Index (NDMI) is an extension of NDVI, designed to assess the water content in vegetation. It was originally proposed by Gao (1996) and utilizes the Near-Infrared (NIR) and Shortwave Infrared (SWIR) bands
“NDWI index is often used synonymously with the NDMI index, often using NIR-SWIR combination as one of the two options. Gao, referenced above, also called the index NDWI. NDMI seems to be consistently described using NIR-SWIR combination. As the indices with these two combinations work very differently, with NIR-SWIR highlighting differences in water content of leaves, and GREEN-NIR highlighting differences in water content of water bodies, we have decided to separate the indices on our repository as NDMI using NIR-SWIR, and NDWI using GREEN-NIR” (sentinelhub.com)
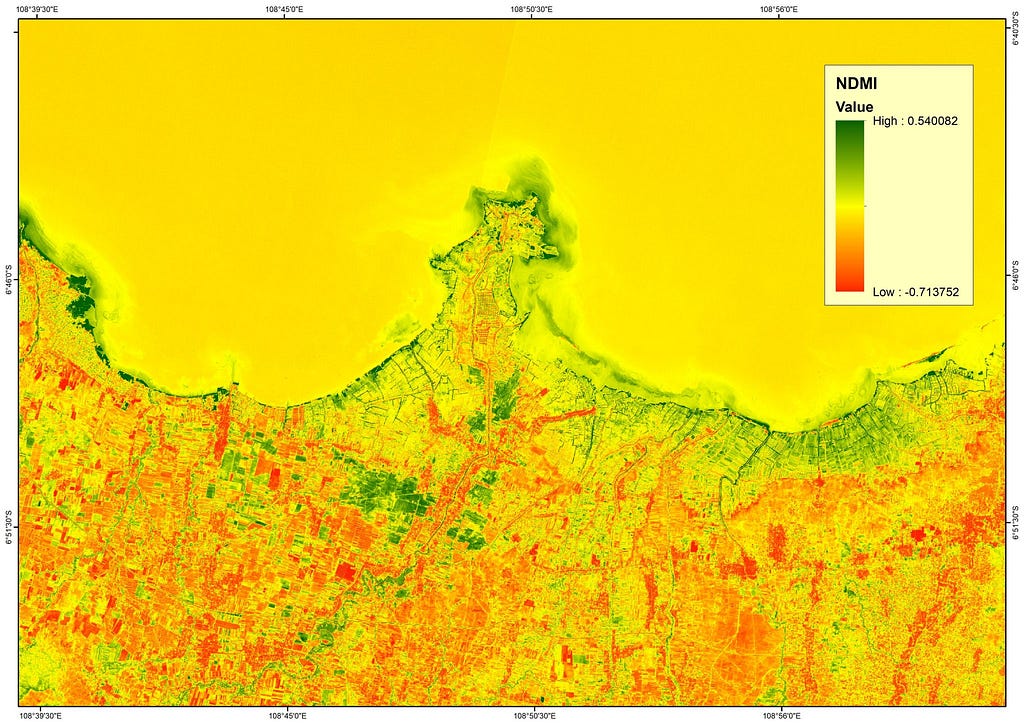
NDMI = (B8 - B11) / (B8 + B11)NDVI (Normalized Difference Vegetation Index):
The Normalized Difference Vegetation Index (NDVI) is a widely used remote sensing index that measures vegetation health and biomass. It was first introduced by Rouse et al. (1974) as a way to monitor plant growth and ecosystem dynamics using satellite imagery. NDVI is calculated using the reflectance values of the Near-Infrared (NIR) and Red bands:
Where: NIR (Near-Infrared, ~0.76–0.9 µm): Strongly reflected by healthy vegetation. Red (~0.63–0.69 µm): Strongly absorbed by chlorophyll in plants. NDVI values range from -1 to +1:
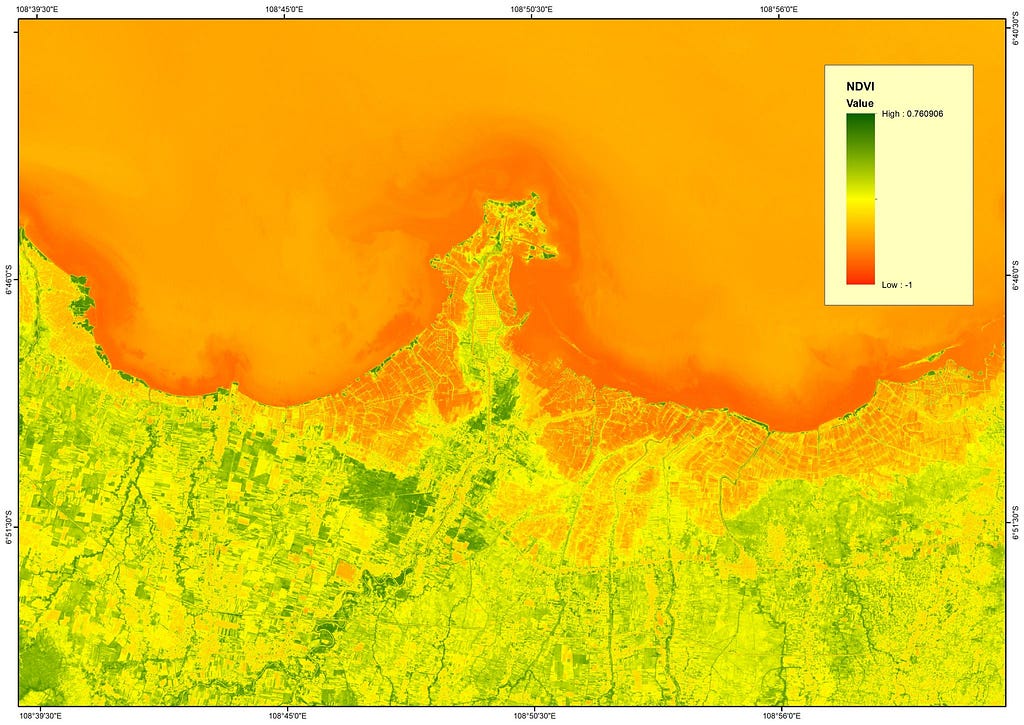
NDVI = (B8 - B4) / (B8 + B4)Step 4: Applying Threshold-Based Classification
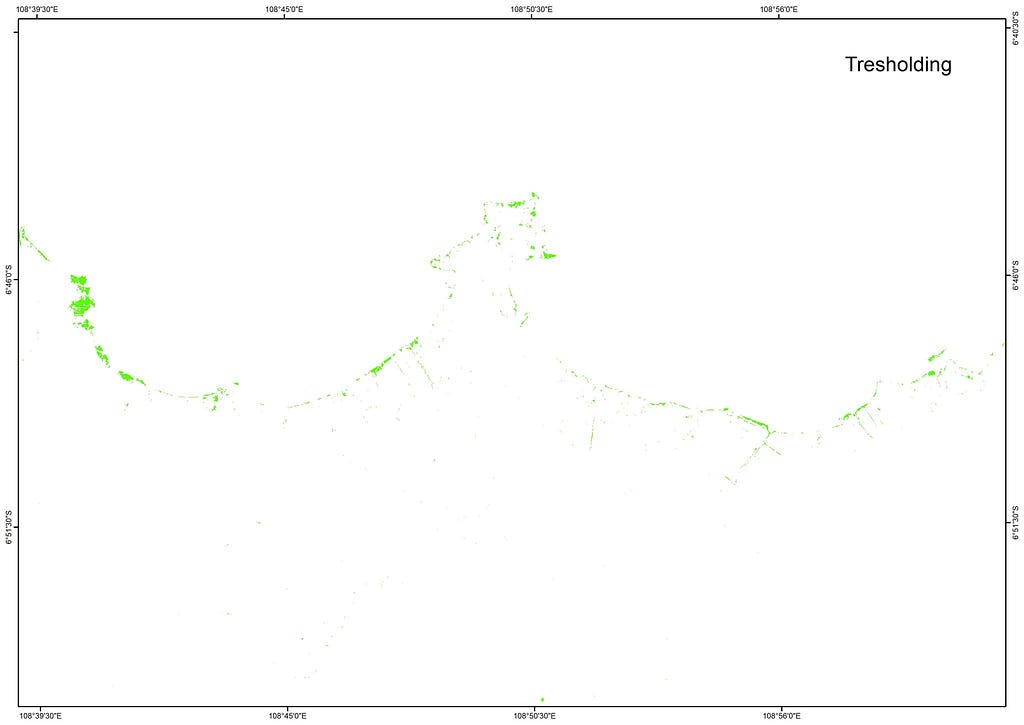
Using the Raster Calculator in ArcGIS, I classified mangrove areas using the following conditional formula:
Con((NDMI > 0.2) & (NDVI > 0.3) & ((B8 / B11) > 1.2), 1, 0)NDMI > 0.2 identifies moisture-rich vegetation. NDVI > 0.3 ensures that the area is covered with vegetation. NIR/SWIR Ratio (B8 / B11) > 1.2 distinguishes mangroves from other vegetation types.
Step 5: Visualizing the Results
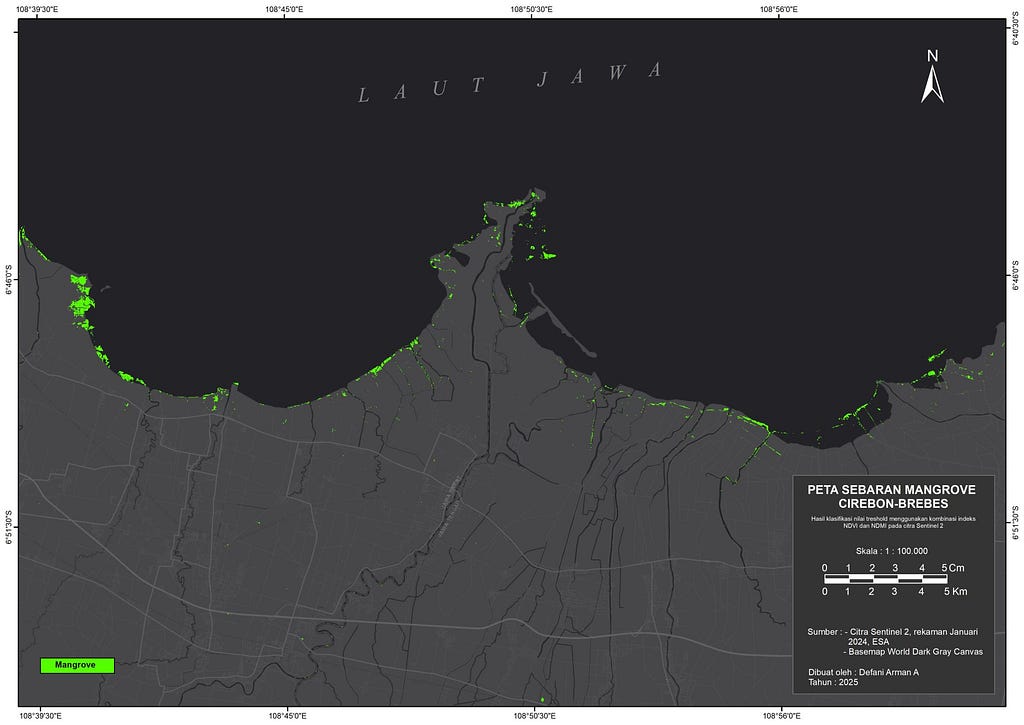
After classification, I overlaid the results on the Sentinel-2 imagery to validate the extracted mangrove areas. The classified map effectively separated mangrove and non-mangrove regions.
References
Gao, B.-C. (1996). “NDWI — A normalized difference water index for remote sensing of vegetation liquid water from space.” Remote Sensing of Environment, 58(3), 257–266. Gao (1996)
Rouse, J. W., Haas, R. H., Schell, J. A., & Deering, D. W. (1974). “Monitoring vegetation systems in the Great Plains with ERTS.” Proceedings of the Third Earth Resources Technology Satellite (ERTS) Symposium, Volume 1, 309–317.
Sentinel Hub Custom Scripts. “NDMI — Normalized Difference Moisture Index.” Sentinel Hub, https://
.
- Gao, B. (1996). NDWI—A normalized difference water index for remote sensing of vegetation liquid water from space. Remote Sensing of Environment, 58(3), 257–266. 10.1016/s0034-4257(96)00067-3