30 March 2025 · Terbit pertama di Medium · Semua tulisan
In remote sensing analysis, one of the key parameters used to monitor water presence is the Normalized Difference Water Index (NDWI). NDWI is calculated using satellite imagery, one of which comes from Sentinel-2, provided by the European Union’s Copernicus program. In this article, we will use Google Earth Engine (GEE) to calculate NDWI from Sentinel-2 data and visualize it.
Understanding Sentinel-2
Sentinel-2 is a high-resolution remote sensing satellite with multiple spectral bands that can be used for various analyses, including land cover identification and water monitoring. In this analysis, we will use Sentinel-2 imagery with atmospheric correction (COPERNICUS/S2_SR_HARMONIZED).
Data Processing in Google Earth Engine
Here are the steps for processing Sentinel-2 data in Google Earth Engine:
1. Loading and Filtering Sentinel-2 Data
var sentinel2 = ee.ImageCollection('COPERNICUS/S2_SR_HARMONIZED')

  .filterDate('2024-01-01', '2025-01-01')

  .filter(ee.Filter.lt('CLOUDY_PIXEL_PERCENTAGE', 20))

  .map(function(img) { return img.updateMask(img.select('QA60').eq(0)); })

  .median().clip(table).multiply(0.0001);
This code performs:
Retrieving Sentinel-2 data within a one-year period (2024–01–01 to 2025–01–01)
Filtering images with cloud cover below 20%.
Removing cloud effects using the QA60 band.
Taking the median value of the remaining images and clipping it to the study area.
2. Calculating NDWI
NDWI is calculated using the formula: NDWI=Green−NIRGreen+NIRNDWI = \frac{Green — NIR}{Green + NIR} In Sentinel-2, the green band is B3, and the Near-Infrared (NIR) band is B8. Implementation in GEE:
var NDWI = sentinel2.normalizedDifference(['B3', 'B8']).rename('NDWI');3. Visualizing NDWI
To display NDWI on the map with a specific color scale:
var ndmiVis = {

  min: -1, max: 1,

  palette: ['#00441b', '#2a924a', '#78c679', '#c2e699', '#ffffcc',

            '#f7fcfd', '#deebf7', '#9ecae1', '#4292c6', '#084594']

};


Map.addLayer(NDWI, ndmiVis, 'Sentinel 2 - NDWI');
This code displays NDWI with a color scale ranging from dark green (saturated water) to dark blue (very dry areas).
4. Adding a Legend
var legend = ui.Panel({ style: { position: 'bottom-right', padding: '2px', backgroundColor: 'white' } })

  .add(ui.Label('NDWI Value', { fontWeight: 'bold', fontSize: '12px' }));


var values = ['-1.0', '-0.6', '-0.2', '0.0', '0.2', '0.4', '0.6', '0.8', '0.9', '1.0'];

var legendPanel = ui.Panel({ layout: ui.Panel.Layout.flow('vertical') });


ndmiVis.palette.forEach(function(color, i) {

  legendPanel.add(ui.Panel({

    widgets: [

      ui.Label({ style: { backgroundColor: color, padding: '8px 12px', margin: '0px', width: '19px' } }),

      ui.Label(values[i], { margin: '0px', fontSize: '10px', textAlign: 'left' })

    ],

    layout: ui.Panel.Layout.Flow('horizontal'),

    style: { margin: '0px', padding: '0px' }

  }));

});


Map.add(legend.add(legendPanel));
This code adds a legend in the bottom-right corner to explain the NDWI values on the map.
5. Displaying Data
To view the processed Sentinel-2 imagery, we can print the result in the console:
print(sentinel2);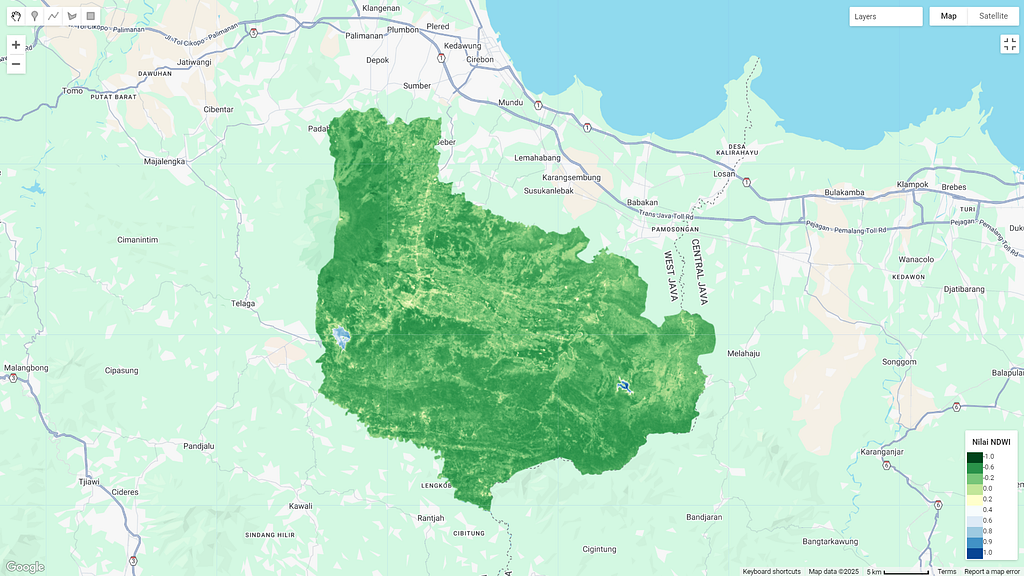
Interpreting NDWI
Positive values (close to 1) indicate water bodies such as rivers, lakes, or wetlands.
Negative values indicate non-water areas such as dry land and vegetation.
Values close to zero typically indicate moist land or areas with low water content.
Conclusion
Using Google Earth Engine, we can easily calculate and visualize NDWI from Sentinel-2 imagery. This analysis is highly useful for water resource monitoring, wetland change detection, and other environmental management applications.
What’s next? If you are interested in further analysis, you can try other indices such as NDVI for vegetation analysis or MNDWI for more accurate water identification. Happy coding!