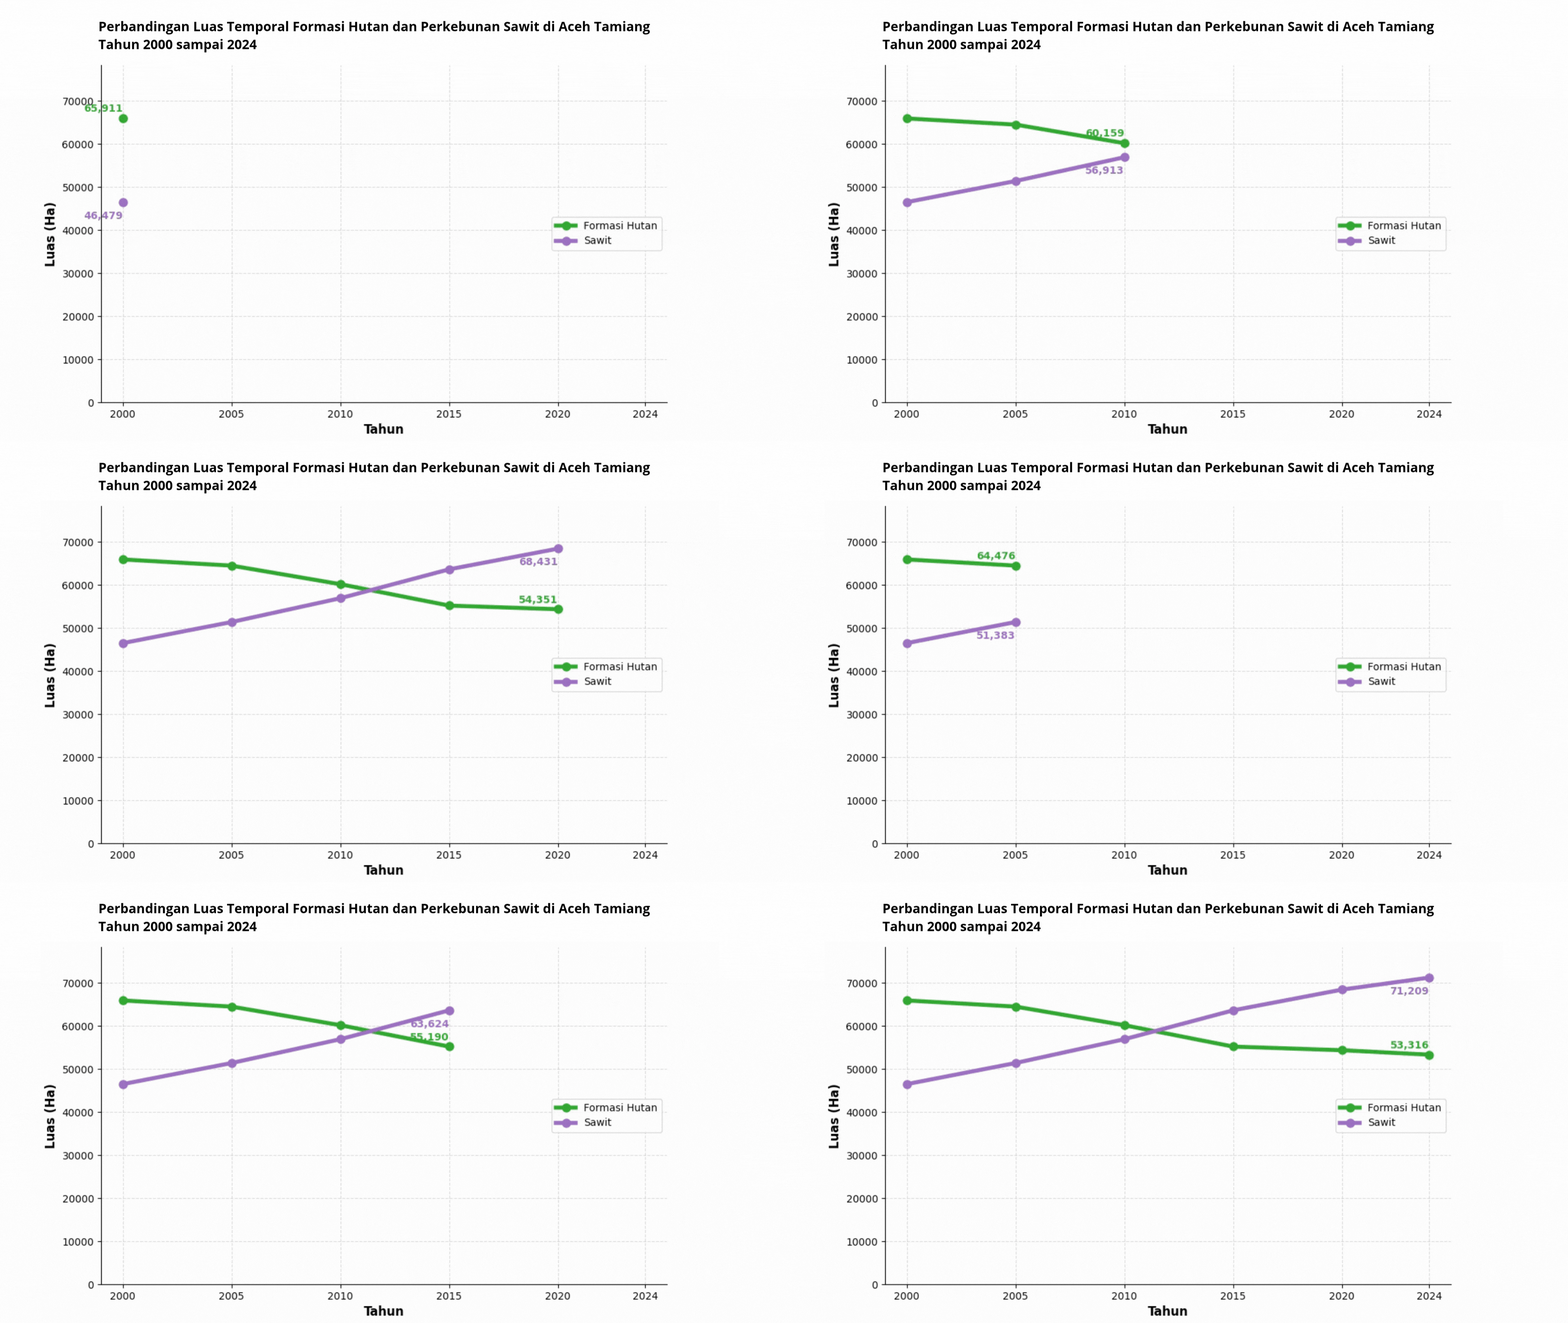
An animated line chart visualizing the temporal dynamics of Forest Formation (Formasi Hutan) and Oil Palm Plantation (Sawit) land cover areas in Aceh Tamiang Regency, Indonesia from 2000 to 2024. Built with Python, matplotlib.animation, and pandas.




An animated line chart visualizing the temporal dynamics of Forest Formation (Formasi Hutan) and Oil Palm Plantation (Sawit) land cover areas in Aceh Tamiang Regency, Indonesia from 2000 to 2024. Built with Python, matplotlib.animation, and pandas.
📌 Overview
This notebook produces a frame-by-frame animated line plot that progressively reveals land cover area changes across six temporal snapshots (2000, 2005, 2010, 2015, 2020, 2024). The animation is exported as a
ile and also rendered interactively in Jupyter/Colab via to_jshtml().
The visualization is intended to support land change analysis in the context of tropical deforestation monitoring, particularly in areas experiencing oil palm encroachment into forested landscapes — a critical concern for mangrove and peatland carbon stock assessments in coastal Aceh.
📂 Repository Structure
├── Animasi_Plot_Race.ipynb          # Main notebook
├── README.md                        # Project documentation
└── Rangkaian waktu Wilayah • Wilayah berdasarkan kelas • 1990 - 2024.csv
                                     # Input land cover time-series data
📊 Data Source
| Field | Description |
|---|---|
| Source | Land cover time-series classification (MapBiomas / local derivative) |
| Region | Aceh Tamiang Regency, Aceh Province, Indonesia |
| Classes | Formasi Hutan (Forest Formation), Sawit (Oil Palm Plantation) |
| Period | 1990–2024 (subset used: 2000–2024) |
| Unit | Hectares (Ha) |
| Column key | Tingkat 2 = land cover class label |
⚠️ The CSV file must be placed in the same working directory as the notebook before execution.
🔧 Requirements
Python Libraries
pip install pandas matplotlib pillow| Library | Version Tested | Purpose |
|---|---|---|
pandas | ≥ 1.3 | Data loading and reshaping |
matplotlib | ≥ 3.4 | Plotting and animation |
Runtime Environment
Google Colab (recommended) — no local installation required
Jupyter Notebook / JupyterLab — ensure
ffmpegorpillowis available for animation export
🚀 Usage
1. Clone the Repository
git clone https://github.com/<your-username>/<repo-name>.git
cd <repo-name>
2. Upload Data (if using Google Colab)
from google.colab import files
uploaded = files.upload()  # Upload the CSV file
3. Run the Notebook
Execute cells sequentially (Steps 1–10). The animation will:
Display interactively in the notebook output
Export as
grafik_garis_temporal.gifin the working directory
🧱 Notebook Structure
| Step | Cell Description |
|---|---|
| 1 | Import libraries (pandas, matplotlib, animation) |
| 2 | Load and filter CSV data for target land cover classes |
| 3 | Define temporal snapshots (2000–2024) |
| 4 | Reshape data: set year as index (X-axis) |
| 5 | Assign class colors (#2ca02c for Forest, #9467bd for Oil Palm) |
| 6 | Configure axes limits, ticks, labels, and title |
| 7 | Initialize animated line objects with markers |
| 8 | Add dynamic text labels at line endpoints |
| 9 | Define update() function for frame-by-frame rendering |
| 10 | Execute FuncAnimation, export GIF, and display HTML |
⚙️ Key Parameters
# Temporal snapshots used in animation
years = ['2000', '2005', '2010', '2015', '2020', '2024']

# Animation settings
interval = 800      # Milliseconds between frames
fps      = 1.5      # Frames per second for GIF export

# Color scheme
colors = {
    'Formasi Hutan': '#2ca02c',   # Forest green
    'Sawit':         '#9467bd'    # Purple (oil palm)
}
📤 Output
| File | Description |
|---|---|
grafik_garis_temporal.gif | Animated GIF of the temporal line chart |
| Notebook inline output | Interactive HTML animation via ani.to_jshtml() |
⚠️ Known Issues & Notes
Cell dependency: Steps 6–9 reference
ax,fig,line_hutan, etc., which must be initialized before those cells run. Ensure all cells are executed in order.Missing
fig, axinitialization: The notebook as structured requires afig, ax = plt.subplots(...)cell to be added before Step 6 for standalone execution outside the original Colab session.Title range mismatch: The chart title reads
2000–2014but the data and animation cover2000–2024. Update the title string in Step 6 accordingly.
🌍 Scientific Context
This animation supports temporal land cover analysis relevant to:
Tropical deforestation monitoring in Sumatra’s coastal regencies
Carbon stock change assessment — forest-to-oil-palm conversion represents a significant reduction in above-ground biomass and soil organic carbon
Mangrove buffer zone analysis — Aceh Tamiang contains coastal mangrove ecosystems sensitive to upstream land use pressure
Integration with remote sensing indices (NDVI, EVI, LSWI) derived from Landsat or Sentinel-2 time series for cross-validation of land cover transitions
Author
Name : Defani Arman Alfitriansyah Institution : Universitas Kuningan
📝 License
This project is licensed under the MIT License.
Notebook
Notebook dari repositori ini, tampil lengkap dengan sel kode dan hasilnya: