Tutorial R, terbit pertama di RPubs (2025-10-01).
by : Defani Arman Alfitriansyah
Forestry Student Faculty of Forestry and Environmental Science University of Kuningan, West Java, Indonesia
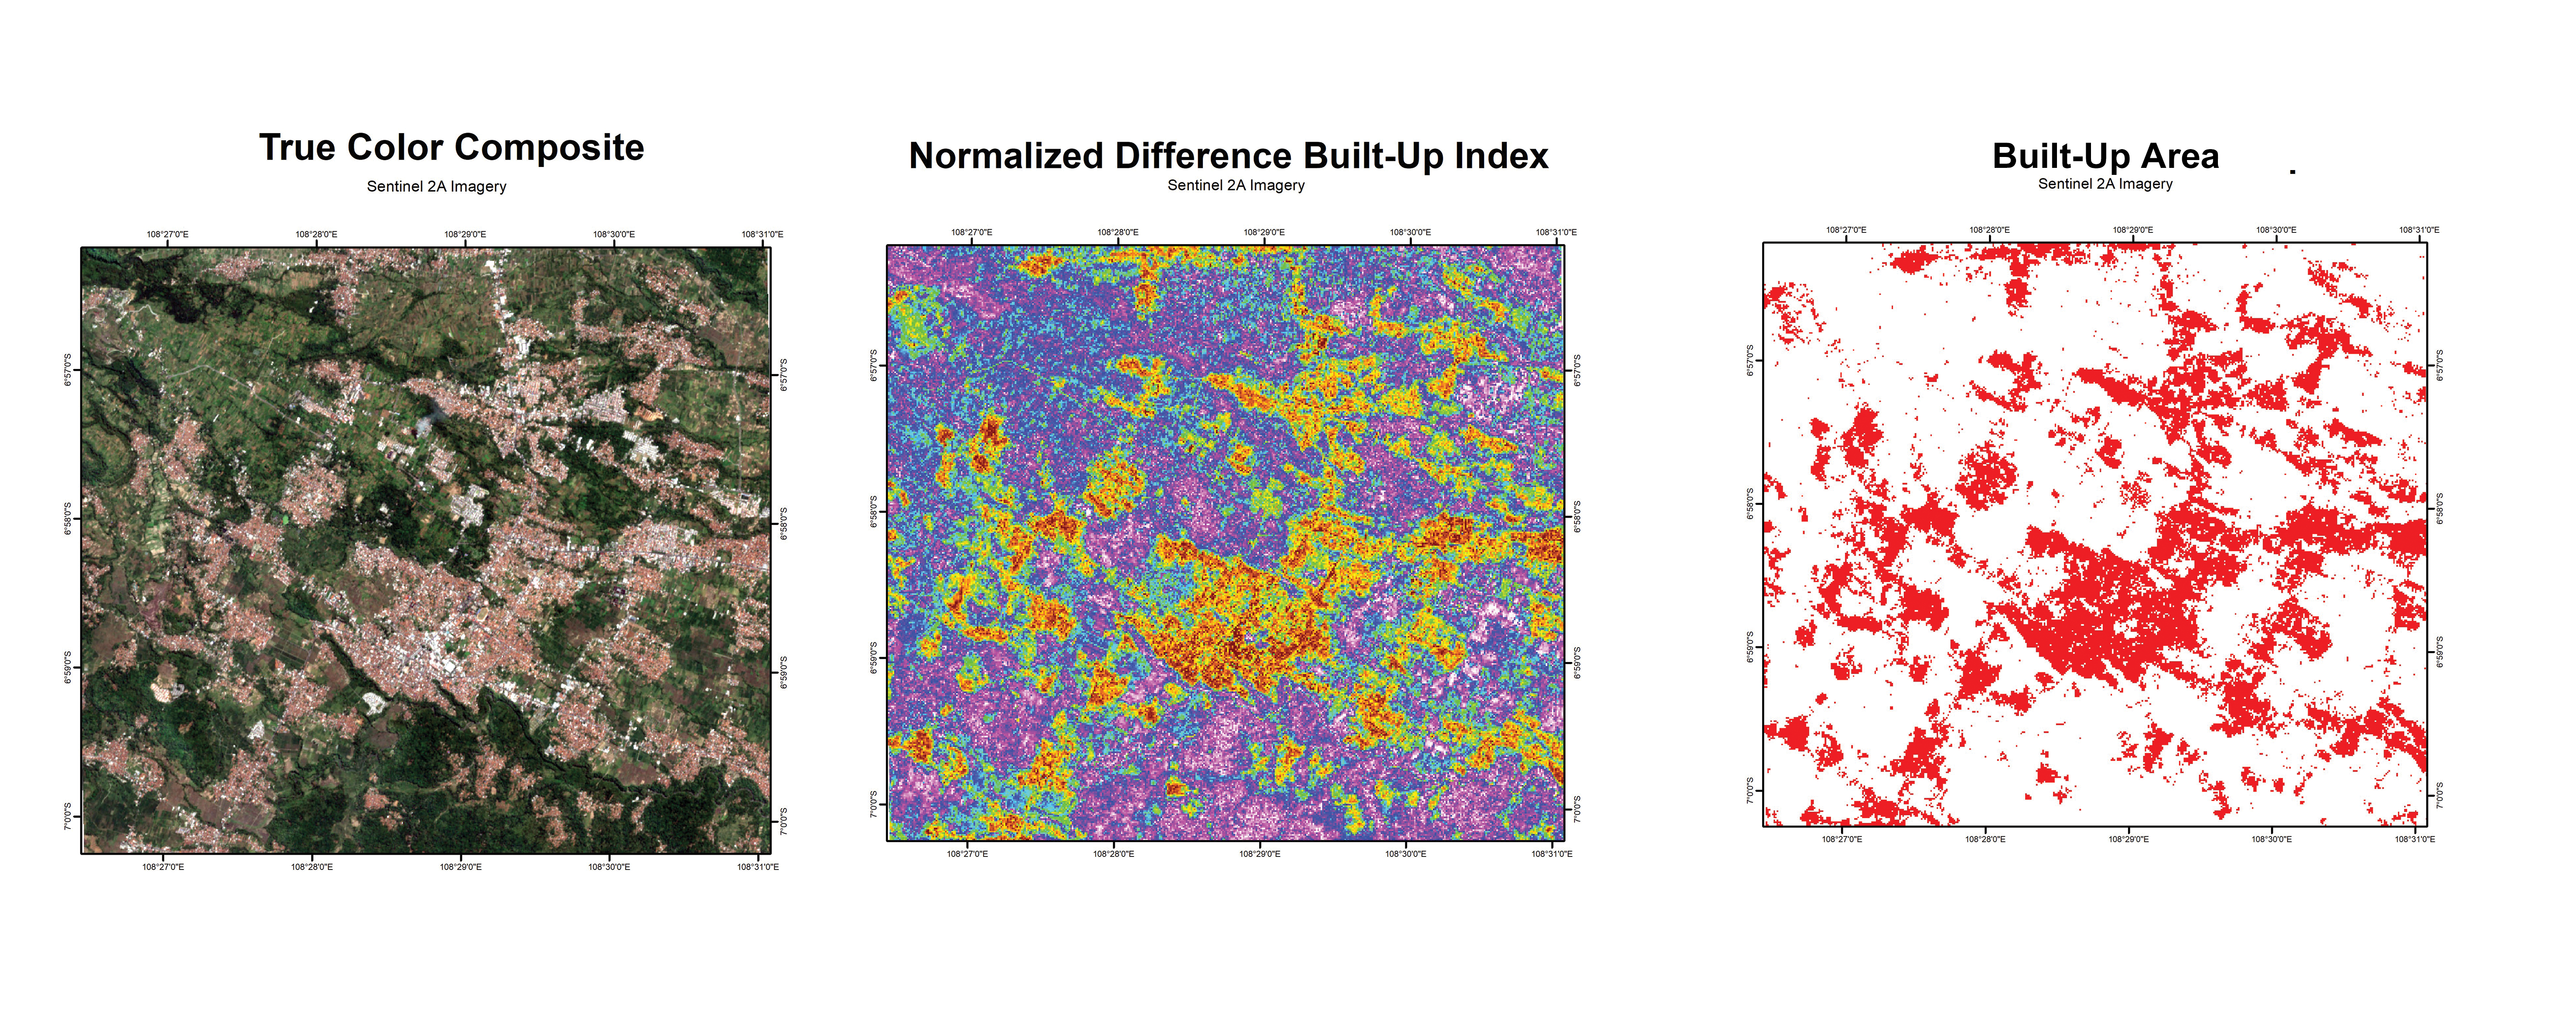
NDBI (Normalize Difference Built-Up Index)
Built-up area extraction can be effectively conducted using the Normalized Difference Built-up Index (NDBI), which was introduced by Zha et al. (2003) to automate the mapping of built-up land. The model was first applied to urban areas in Nanjing, China, achieving an accuracy of 92.6%, and has since been widely adopted for land cover identification, particularly for distinguishing built-up areas including residential settlements, using optical remote sensing data.
The NDBI formula is defined as:
Calculate NDBI Index
Load library
library(terra)terra 1.8.42load raster file
SWIR1 = rast("D:/SPATIAL DATA/RASTER/SWIR1.tif")
NIR = rast("D:/SPATIAL DATA/RASTER/NIR.tif")

print(NIR)
class : SpatRaster
dimensions : 931, 868, 1 (nrow, ncol, nlyr)
resolution : 10, 10 (x, y)
extent : 880180, 888860, 9223500, 9232810 (xmin, xmax, ymin, ymax)
coord. ref. : WGS 84 / UTM zone 48S (EPSG:32748)
source : NIR.tif
name : Grayscale
min value : 1090
max value : 17041 print(SWIR1)class : SpatRaster
dimensions : 466, 434, 1 (nrow, ncol, nlyr)
resolution : 20, 20 (x, y)
extent : 880180, 888860, 9223500, 9232820 (xmin, xmax, ymin, ymax)
coord. ref. : WGS 84 / UTM zone 48S (EPSG:32748)
source : SWIR1.tif
name : Band_1
min value : 1167
max value : 11593 Resample data
Ressample_band = resample(SWIR1, NIR)
print(Ressample_band)
class : SpatRaster
dimensions : 931, 868, 1 (nrow, ncol, nlyr)
resolution : 10, 10 (x, y)
extent : 880180, 888860, 9223500, 9232810 (xmin, xmax, ymin, ymax)
coord. ref. : WGS 84 / UTM zone 48S (EPSG:32748)
source(s) : memory
varname : NIR
name : Band_1
min value : 1257.00
max value : 10425.06 Math opration band
NDBI = (Ressample_band-NIR)/(Ressample_band+NIR)Plot NDBI
plot(NDBI, col= topo.colors(100),
     plg= list(title= "Value"),
     main= "Normalize Difference Built Up Index")
grid(lty= 2,
     lwd= 0.5,
     col= "gray50")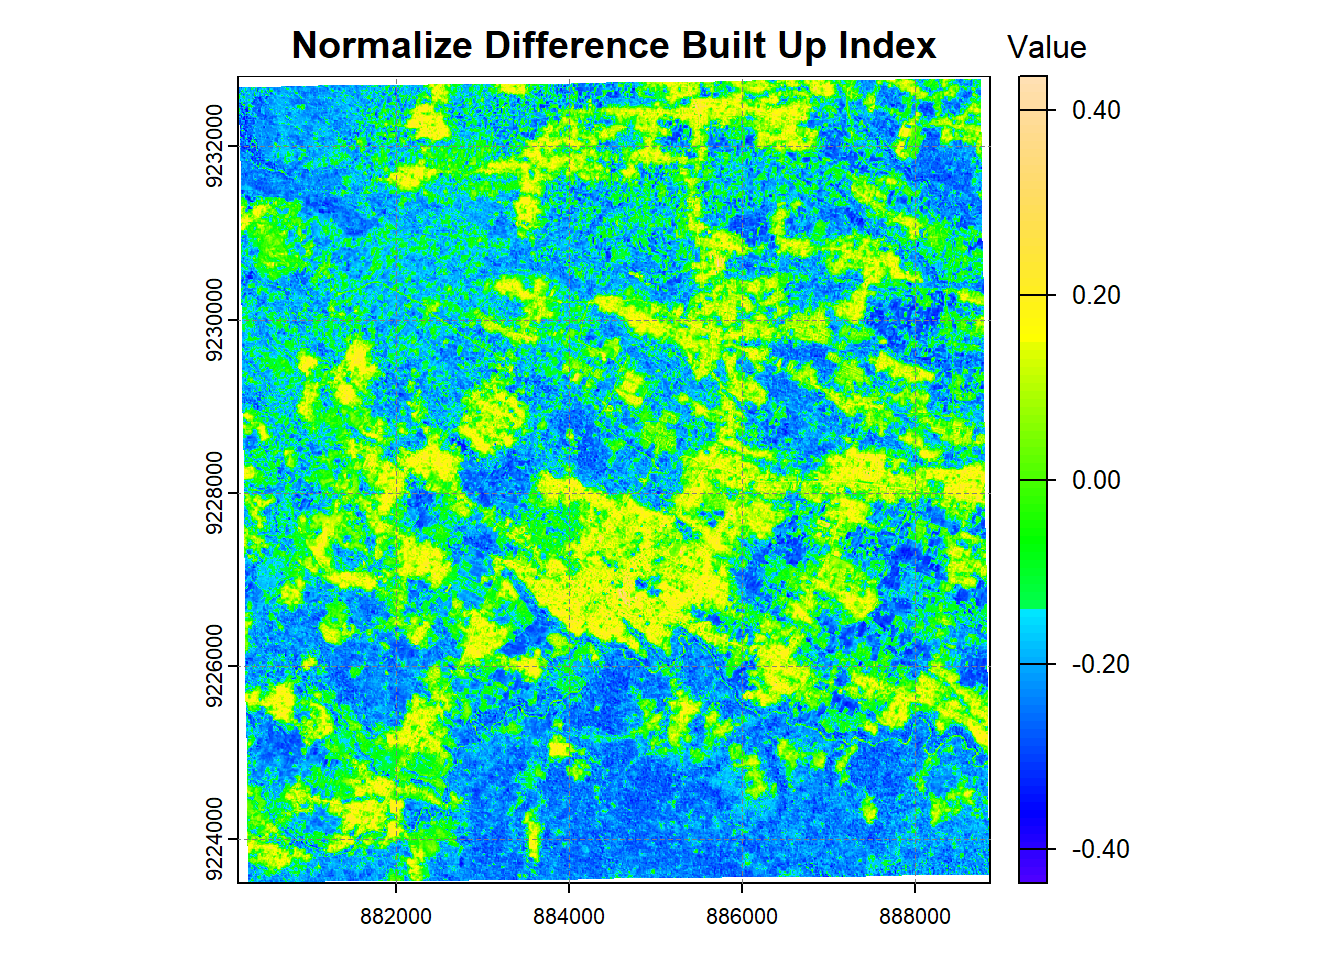
NDBIclass : SpatRaster
dimensions : 931, 868, 1 (nrow, ncol, nlyr)
resolution : 10, 10 (x, y)
extent : 880180, 888860, 9223500, 9232810 (xmin, xmax, ymin, ymax)
coord. ref. : WGS 84 / UTM zone 48S (EPSG:32748)
source(s) : memory
varname : NIR
name : Band_1
min value : -0.4451231
max value : 0.4360467 Threshold Classification
In this analysis, I applied a threshold value of 0.002 to separate built-up from non-built-up land cover. The workflow was implemented in R using Sentinel-2 spectral bands (NIR and SWIR1), followed by resampling to align the raster grids and threshold-based classification. This approach demonstrates how NDBI can be used to detect urban areas and monitor land-use changes.
Threshold Equestion :
Threshold Function Explanation:
The threshold function assigns each pixel to a class based on the computed index value. If , the pixel is classified as built-up (); otherwise, it is classified as non-built-up ().
threshold = 0.01
Built_up = NDBI>threshold
plot(Built_up,
     col= c('white', 'red'),
     legend = FALSE,
     main= "Built Up Area")

grid(lty= 2,
     lwd= 0.5,
     col= "gray50")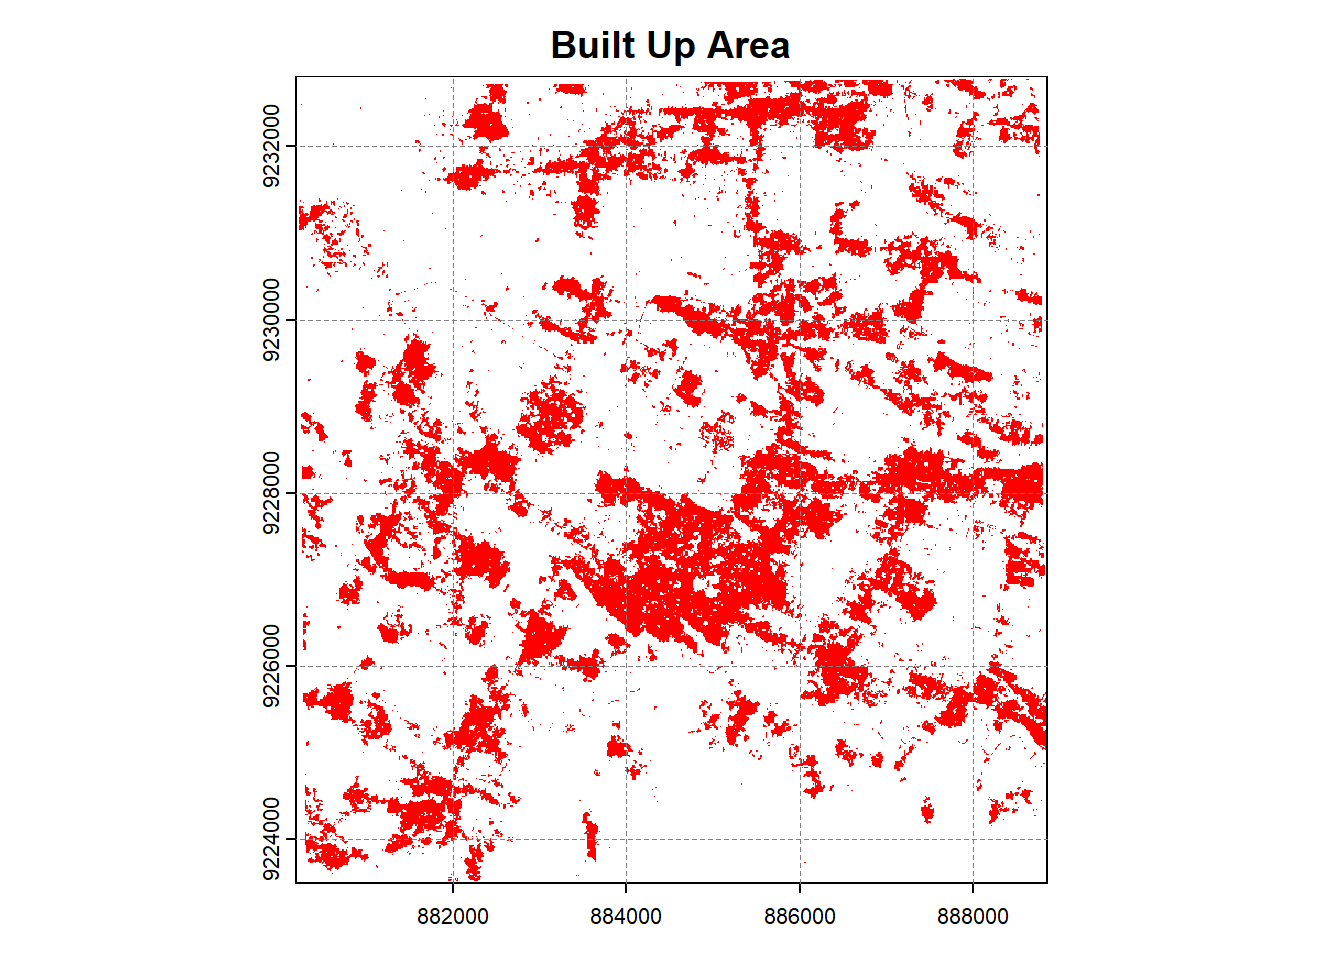
Built_upclass : SpatRaster
dimensions : 931, 868, 1 (nrow, ncol, nlyr)
resolution : 10, 10 (x, y)
extent : 880180, 888860, 9223500, 9232810 (xmin, xmax, ymin, ymax)
coord. ref. : WGS 84 / UTM zone 48S (EPSG:32748)
source(s) : memory
varname : NIR
name : Band_1
min value : FALSE
max value : TRUE References
Muhaimin, M., Fitriani, D., Adyatma, S., & Arisanty, D. (2022). Mapping build-up area density using normalized difference built-up index (NDBI) and urban index (UI) wetland in the city Banjarmasin. IOP Conference Series: Earth and Environmental Science, 1089(1), 012036. https://lnkd.in/gR749BEF
Zha, Y., Gao, J., & Ni, S. (2003). Use of normalized difference built-up index in automatically mapping urban areas from TM imagery. International Journal of Remote Sensing, 24(3), 583–594. https://lnkd.in/gxvMPmHF