A Claude Skill for rendering single-band, continuous-value georeferenced rasters (GeoTIFF) into publication-style map figures
Note: You just need to download click here
continuous-raster-visualization.skillfile.
A Claude Skill for rendering single-band, continuous-value georeferenced rasters (GeoTIFF) into publication-style map figures, built for remote sensing workflows such as LST, NDVI, IRECI, TRVI, and AGC outputs.







Demo
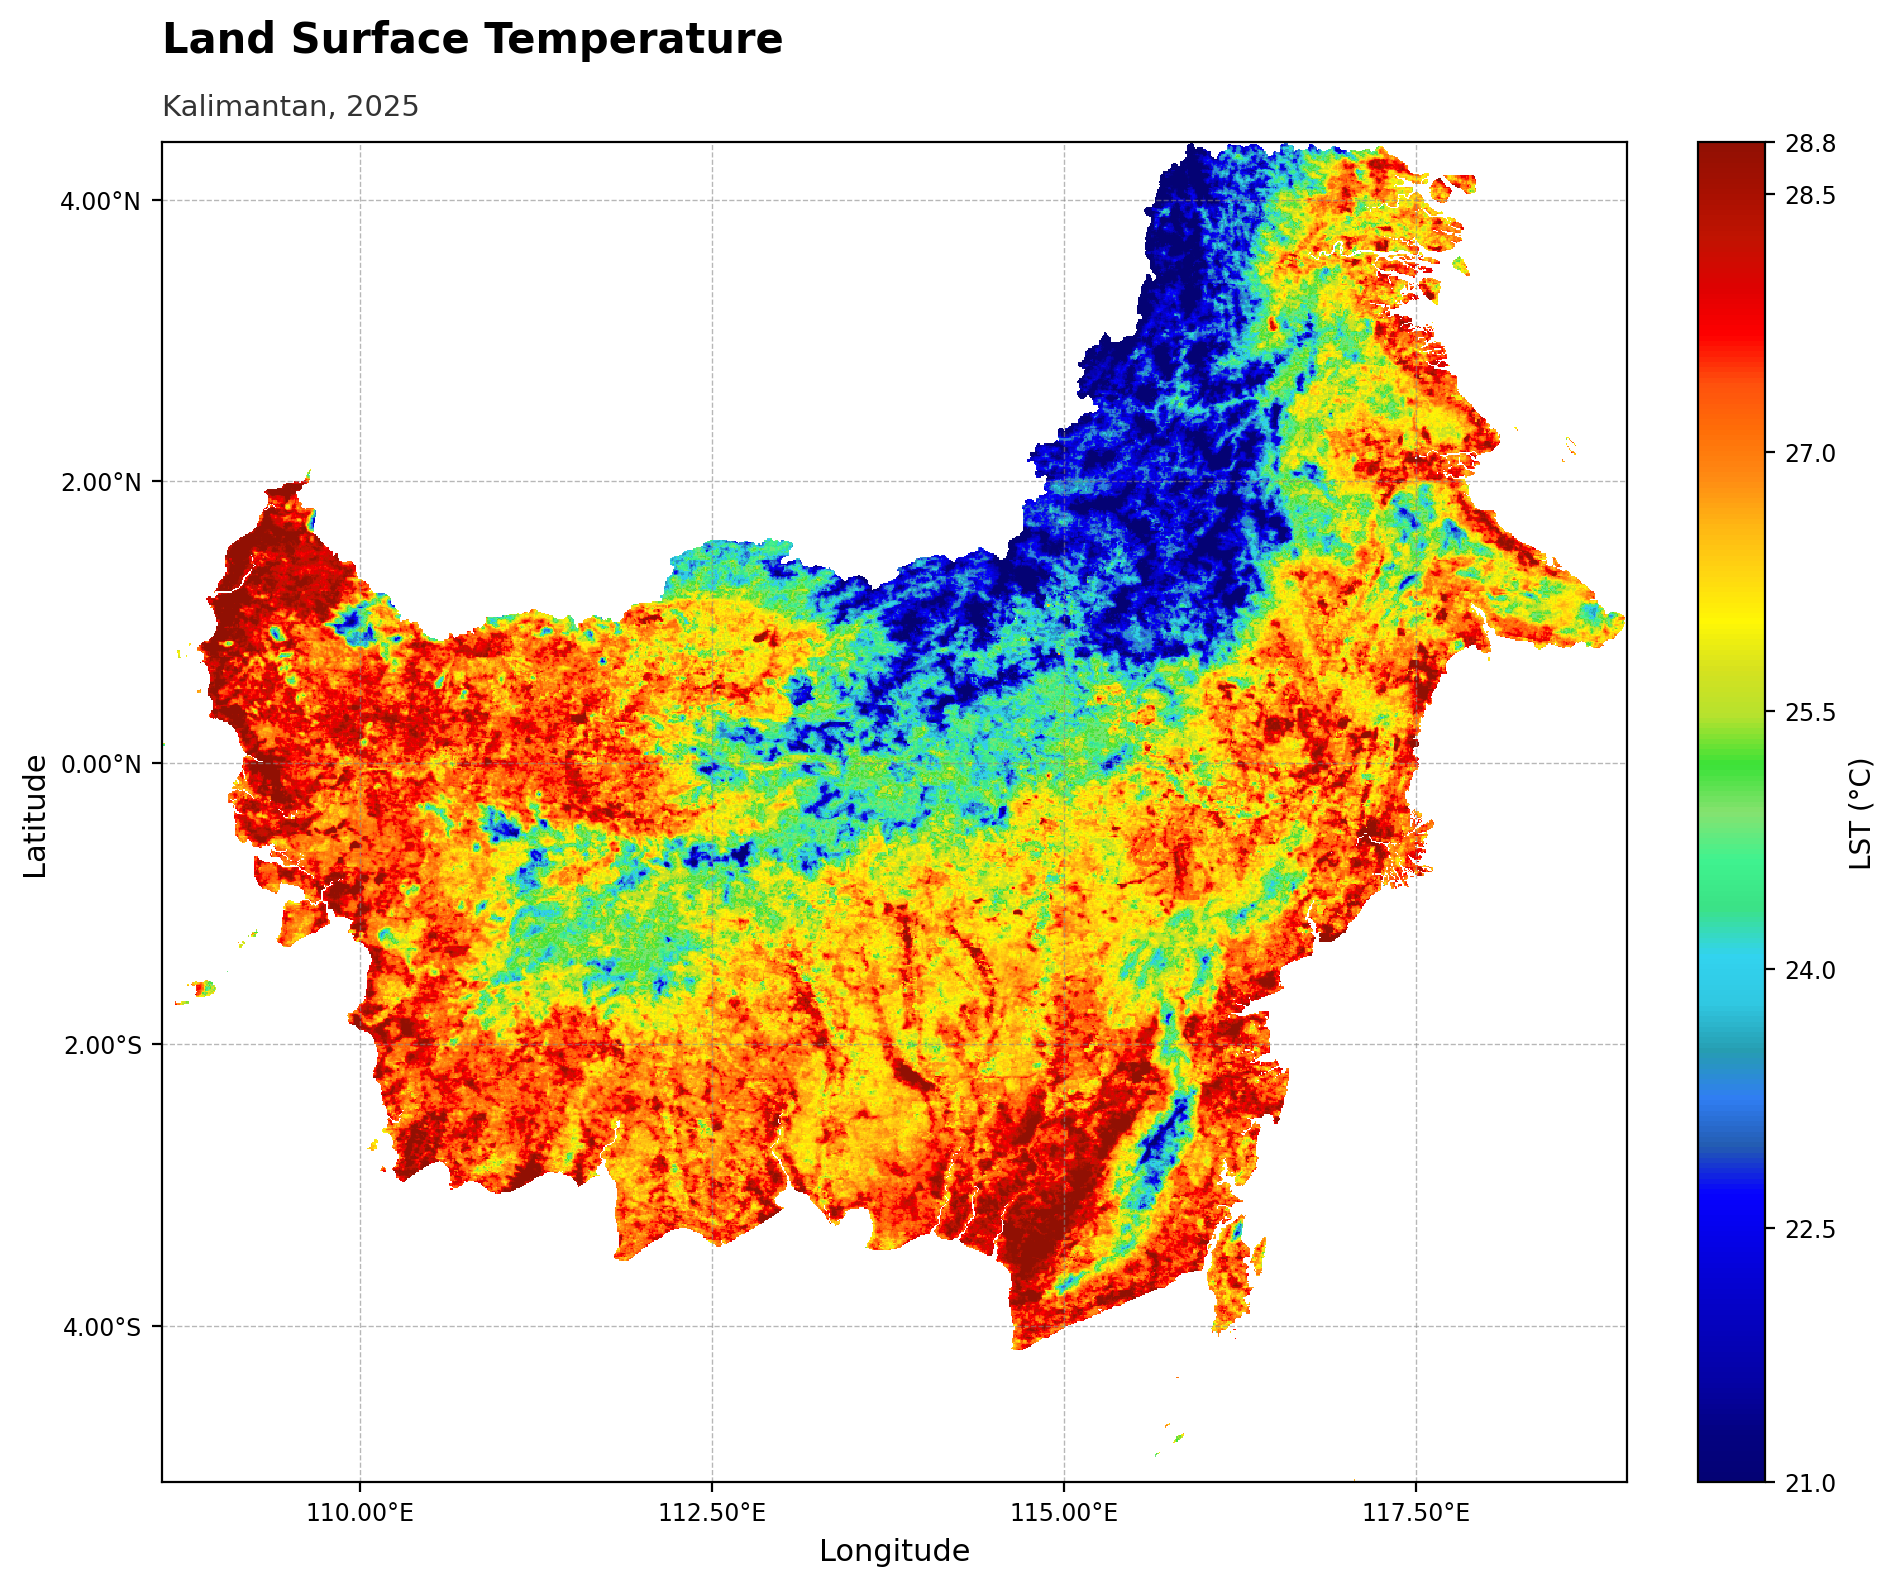
Percentile stretch, lst_classic palette, left-aligned title, English labels — all current defaults.
Skill preview
An interactive, self-contained HTML preview of this skill (badges, palette
gallery, feature list, tech stack, and the demo above) is bundled at
assets/preview.html — download it and open it in any
browser, no server needed.
Language
The first time this skill runs in a conversation, Claude asks which language to use:
English (default) — axis labels
Longitude/Latitude, colorbar labelPixel valueBahasa Indonesia — axis labels
Bujur/Lintang, colorbar labelNilai piksel
The choice only affects default label wording (you can always override any
label with --xlabel/--ylabel/--colorbar-label) and the language Claude
uses when talking about the visualization for the rest of the session. If you
already write to Claude in Indonesian, it infers the choice instead of asking.
Set it explicitly with --language en or --language id (or language="id"
in Python).
What it does
Given a single-band GeoTIFF and a set of options, the skill produces one map figure (PNG/PDF/SVG) with control over:
Stretch: min-max, percentile (default 2-98%), or manual vmin/vmax
Colormap: built-in domain palettes (
lst_classic,water_index,ndvi_custom) or any matplotlib colormap (viridis, magma, YlGn, Spectral, and more)Colorbar orientation (vertical/horizontal), label position (side/top), tick count, and tick decimal precision — the two ends always show the actual data min/max used for the stretch, never rounded placeholder numbers
Coordinate tick format for geographic rasters: DMS, DD, or plain decimal
Gridlines on/off
Font family (serif/sans-serif) and independent title/subtitle font sizes
Title/subtitle spacing and alignment (left by default, or center)
Output language for default labels: English or Bahasa Indonesia
An in-chat interactive settings picker (palette swatches, stretch, colorbar, gridlines, font, etc.) is also available — Claude can render it as a widget so you can pick options visually and apply them with one click instead of typing flags.
Settings reference
| Option | Choices | Default | Notes |
|---|---|---|---|
stretch | minmax, percentile, manual | percentile (2–98%) | manual requires vmin/vmax |
pmin/pmax | any 0–100 | 2/98 | only used when stretch=percentile |
cmap | matplotlib colormap, or named palette (see gallery below) | viridis | pick a perceptually appropriate one for the variable |
colorbar_orient | vertical, horizontal | vertical | |
colorbar_label | free text | Pixel value | set to the actual unit, e.g. LST (°C), AGC (ton/ha), NDVI |
colorbar_label_position | side, top | side | side = rotated label along the bar; top = unrotated label above the bar |
colorbar_nticks | integer ≥2 | auto (~6) | controls how many ticks appear between the endpoints; endpoints always show the true stretch min/max |
colorbar_decimals | integer ≥0 | auto (0/1/2 by span) | decimal places on tick labels — set explicitly (e.g. 0) if the automatic rule looks inconsistent |
coord_format | DMS, DD, D | DD | DMS = D°M’S″ + hemisphere; DD = decimal degrees + hemisphere; D = plain decimal, no symbol. Only affects geographic CRS |
gridlines | on/off | on | dashed, light gray |
grid_step | number (degrees/units) | auto | manual spacing between gridlines/ticks |
font | serif, sans-serif | sans-serif | applies to the whole figure |
background | any matplotlib color | white | |
title / subtitle | free text | none | title is bold, subtitle is plain and smaller |
title_align | left, center | left | aligned to the map’s left edge when left |
title_fontsize / subtitle_fontsize | number | 15 / 10.5 | |
title_gap | number (axes-fraction) | 0.045 | vertical spacing between title and subtitle |
xlabel / ylabel | free text | Longitude/Latitude (geographic) or Easting/Northing (projected) | |
language | en, id | en | sets default axis/colorbar label wording |
figsize | width height | 10 8 | inches |
dpi | integer | 200 |
Available color palettes
Named domain palettes (built into the script) and commonly used matplotlib colormaps — actual gradients rendered below, not just names:
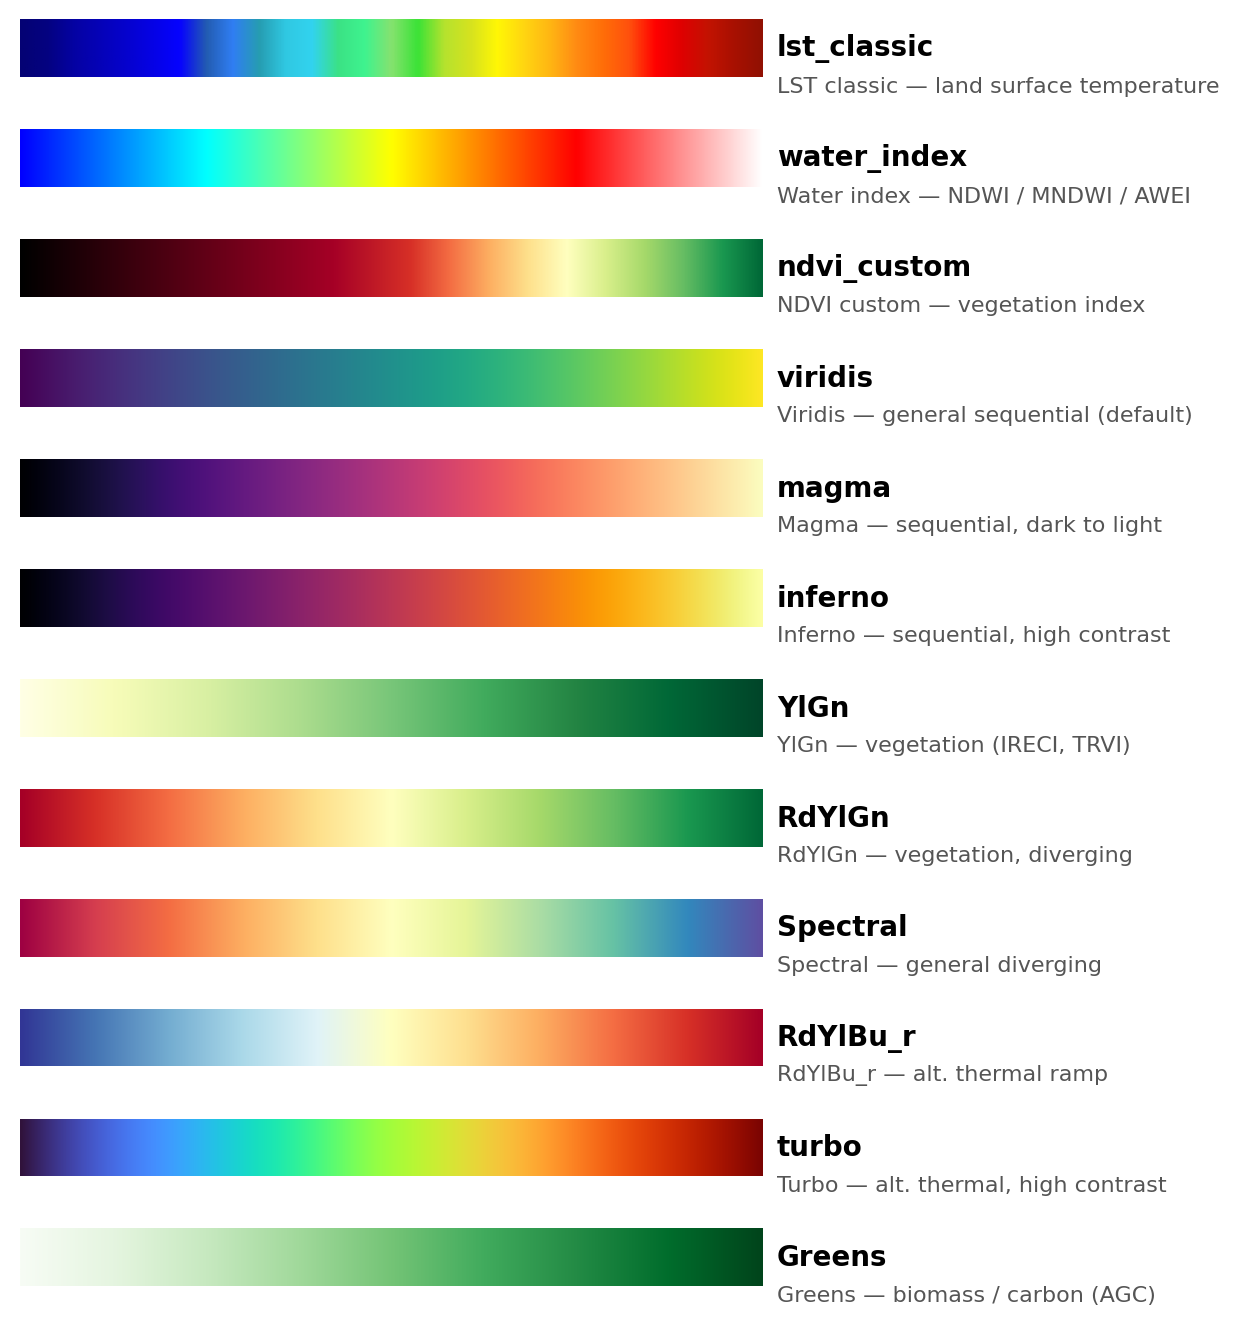
| Palette | Type | Best for |
|---|---|---|
lst_classic | named | Land surface temperature — classic GEE-style thermal ramp |
water_index | named | Water/moisture indices — NDWI, MNDWI, AWEI |
ndvi_custom | named | NDVI specifically — diverging ramp anchored to fixed values (-1.0 to 0.9) |
viridis | matplotlib | General-purpose sequential, perceptually uniform (script default) |
magma | matplotlib | Sequential, dark-to-light — temperature, intensity |
inferno | matplotlib | Sequential, high contrast — temperature |
YlGn | matplotlib | Vegetation indices other than NDVI (IRECI, TRVI) |
RdYlGn | matplotlib | Vegetation indices, diverging red → green |
Spectral | matplotlib | General diverging data |
RdYlBu_r | matplotlib | Alternative thermal ramp |
turbo | matplotlib | Alternative thermal ramp, high contrast |
Greens | matplotlib | Biomass/carbon (AGC), sequential |
Any other built-in matplotlib colormap name also works — pass it directly to
--cmap.
Files
continuous-raster-visualization/
  SKILL.md                 skill definition and usage guide
  scripts/raster_viz.py    the rendering engine (CLI + importable function)
  references/options.md    full parameter reference
  README.md                this file
  LICENSE                  MIT license
Quick start
python3 scripts/raster_viz.py INPUT.tif OUTPUT.png \
    --stretch percentile --pmin 2 --pmax 98 \
    --cmap lst_classic \
    --colorbar-orient vertical --colorbar-label "LST (deg C)" \
    --colorbar-nticks 5 --colorbar-decimals 0 \
    --coord-format DD --gridlines \
    --font sans-serif \
    --title "Land Surface Temperature" --subtitle "Kalimantan, 2025"
Or from Python:
from scripts.raster_viz import plot_raster

plot_raster(
    "INPUT.tif", "OUTPUT.png",
    stretch="percentile", pmin=2, pmax=98,
    cmap="lst_classic",
    colorbar_orient="vertical", colorbar_label="LST (deg C)",
    colorbar_nticks=5, colorbar_decimals=0,
    coord_format="DD", gridlines=True,
    font="sans-serif",
    title="Land Surface Temperature", subtitle="Kalimantan, 2025",
)
See SKILL.md for the full workflow Claude follows when using this skill, and
references/options.md for every parameter in detail.
Engine
Rendering: matplotlib (figure, colormap, colorbar, typography)
Raster I/O: rasterio (GeoTIFF reading, CRS, bounds, nodata handling)
Numerics: NumPy (stretch/percentile computation)
Orchestration: Claude, via this Skill — inspects the raster, resolves options (asking only where genuinely ambiguous), calls
raster_viz.py, and reviews the output before presenting it
License
MIT. See LICENSE.