A QGIS Processing tool that extracts raster pixel values (satellite imagery bands, vegetation indices such as NDVI, NDWI, MNDWI, SAVI, etc.) at field sample point locations automatically
Author: Defani Arman Alfitriansyah
Date: June 09, 2026
Version: 1.0.0
GitHub: https://github .com /Defani /Spectral -Value -Extractor -QGIS -Tooolbox
Overview
A QGIS Processing tool that extracts raster pixel values (satellite imagery bands, vegetation indices such as NDVI, NDWI, MNDWI, SAVI, etc.) at field sample point locations automatically.
Key advantage over the built-in QGIS Sample Raster Values tool:
Supports multiple raster inputs in a single run
Directly exports results to a CSV file
Supports custom band naming
Installation & Step-by-Step Usage
Step 1 — Add Script to Processing Toolbox
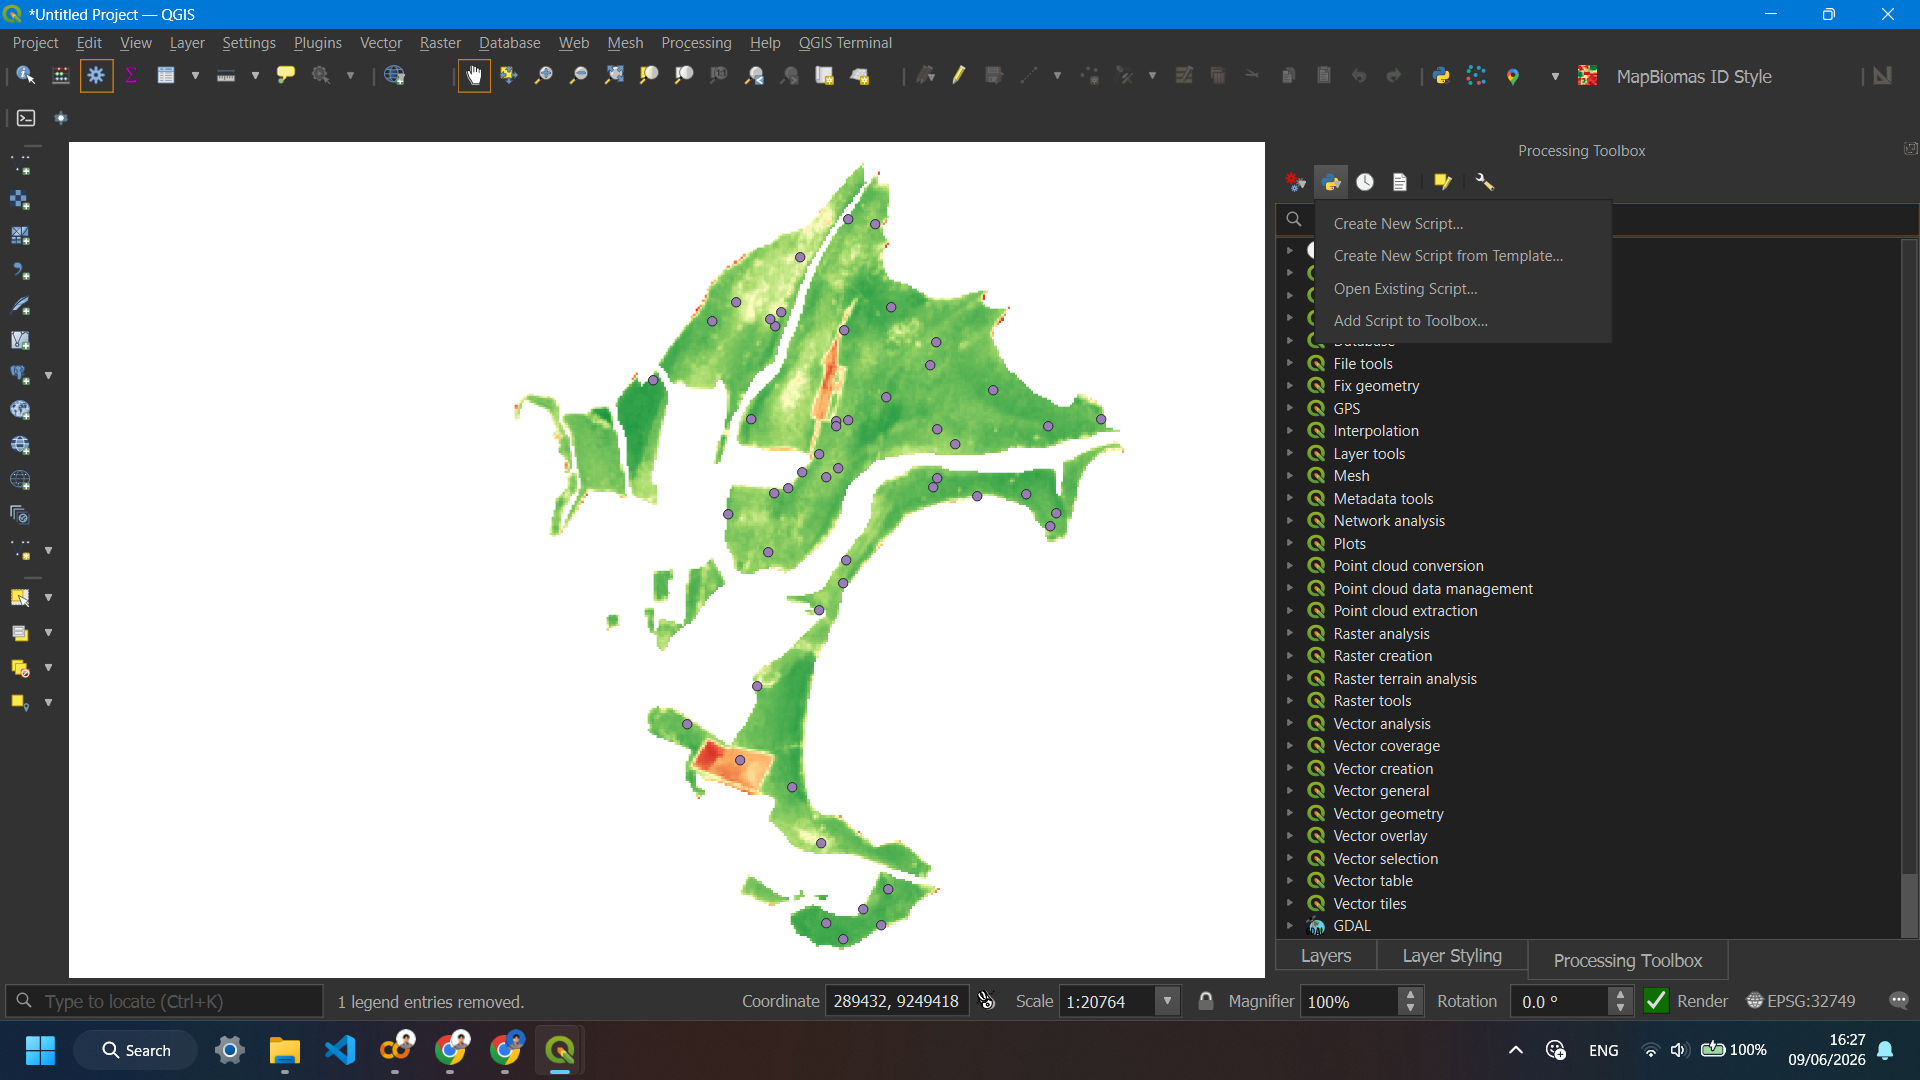
Open Processing → Toolbox, then click the Python icon (⚙️) at the top of the Toolbox panel and select Add Script to Toolbox...
Step 2 — Browse and Select the Script File
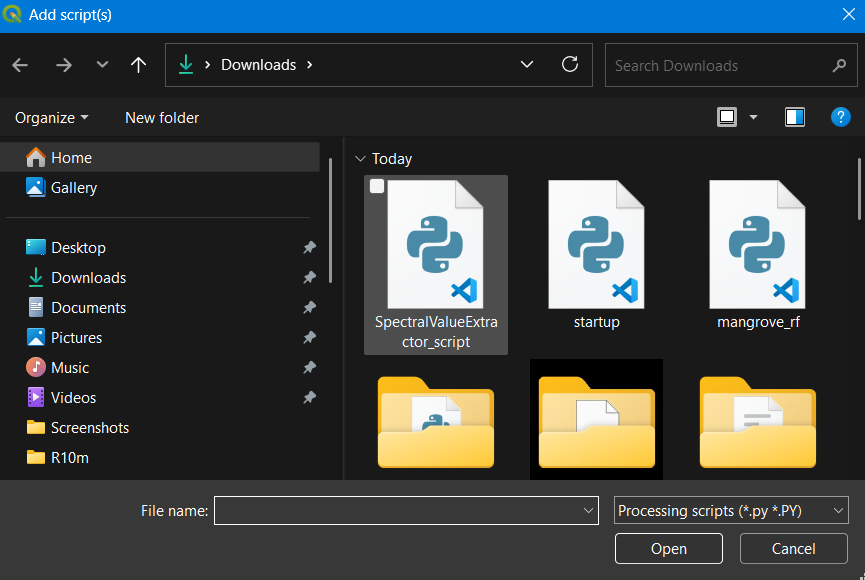
In the file browser that opens, navigate to where you saved SpectralValueExtractor_script.py and select it, then click Open.
Step 3 — Find the Tool in the Toolbox
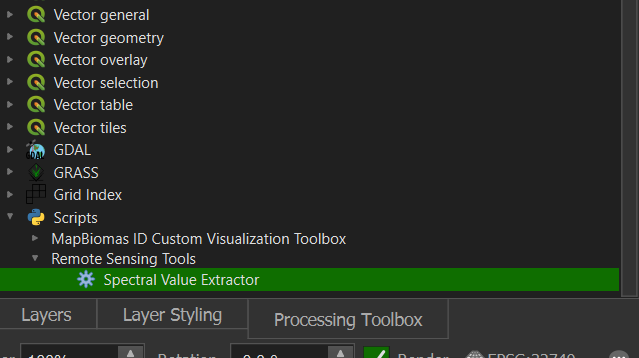
The tool will now appear under Scripts → Remote Sensing Tools → Spectral Value Extractor in the Processing Toolbox. Double-click it to open.
Step 4 — Fill in the Parameters
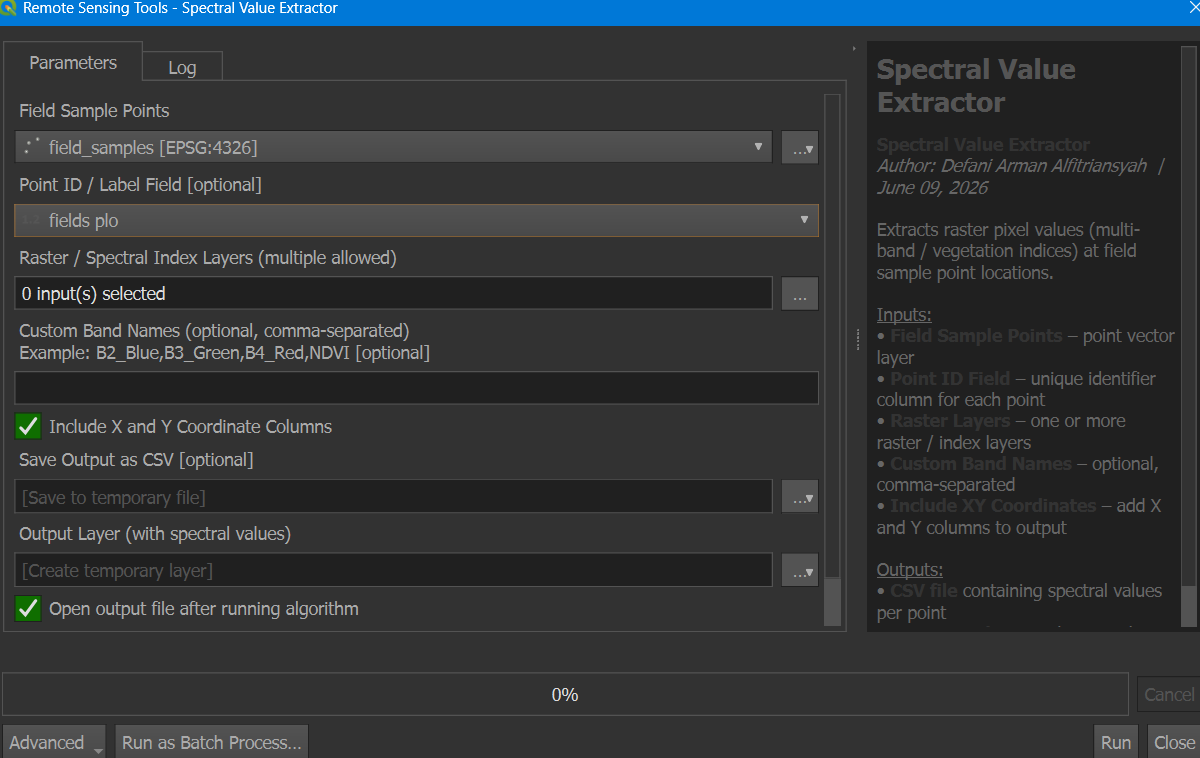
The tool dialog will open. Fill in the following:
Field Sample Points — select your point layer (e.g.
field_samples)Point ID / Label Field — select the column that identifies each point
Raster / Spectral Index Layers — click
...to select one or more rastersCustom Band Names — optional, e.g.
NDVI,SAVIInclude X and Y Coordinate Columns — check this to add coordinate columns
Save Output as CSV — set a file path to save the CSV result
Step 5 — Select Raster Layers
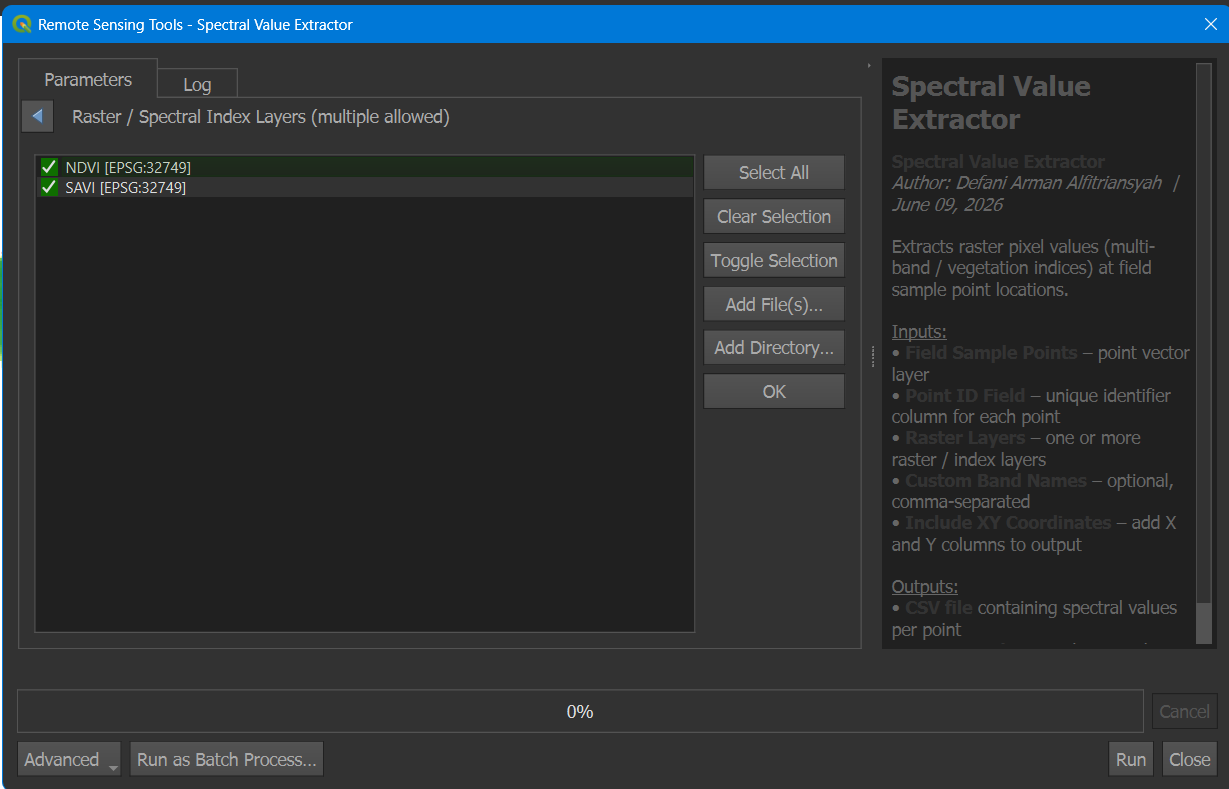
When you click ... next to Raster Layers, a panel opens listing all rasters currently loaded in QGIS. Check all the layers you want to extract values from. You can also use Add File(s)... to load rasters directly from disk without adding them to the map first.
Step 6 — Run and Check the Log
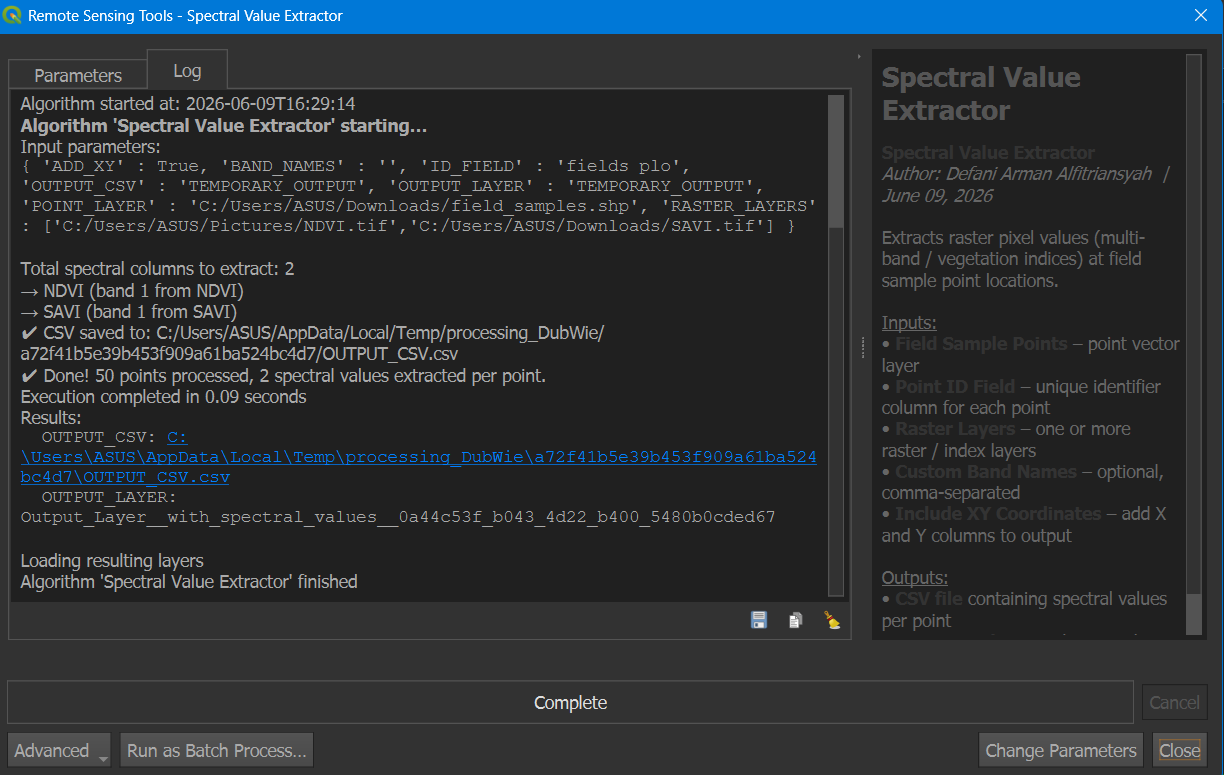
Click Run. The Log tab will show the progress and results — number of points processed, bands extracted, and the CSV output path.
Step 7 — Output Layer Added to QGIS
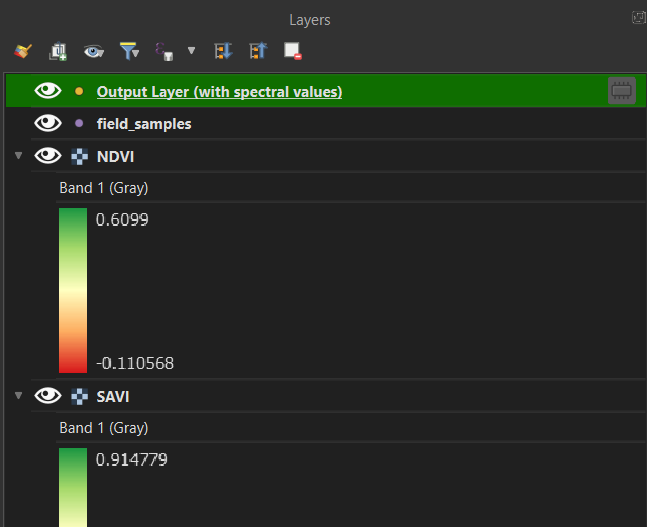
Once finished, the output point layer is automatically added to the Layers panel. It contains all the original point attributes plus the new spectral value columns.
Step 8 — View Results in Attribute Table
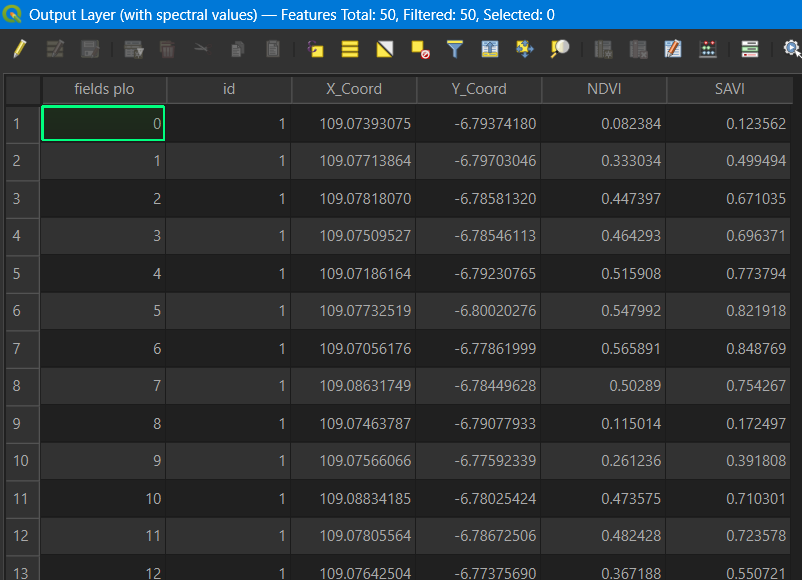
Open the attribute table of the output layer to see the extracted spectral values for each point — including X/Y coordinates and all selected band/index values.
Parameters Reference
| Parameter | Description |
|---|---|
| Field Sample Points | Point vector layer (.shp / .gpkg / etc.) containing field sample locations |
| Point ID / Label Field | Select the column that uniquely identifies each point (e.g. Sample_ID, No, Name) |
| Raster / Spectral Index Layers | Select one or more raster layers — different CRS and resolutions are handled automatically |
| Custom Band Names | Optional. Example: B2_Blue,B3_Green,B4_Red,NDVI — if left empty, column names are taken from the raster file names |
| Include X and Y Coordinate Columns | Check to append X and Y coordinate columns to the output |
| Save Output as CSV | File path for the CSV output |
| Output Layer | New point layer in QGIS with spectral values as attributes |
Notes
If the point layer and raster layers have different CRS, the tool reprojects automatically — no manual reprojection needed.
For multi-band rasters (Sentinel-2, Landsat, etc.), all bands are extracted in a single run.
Shapefile attribute column names are limited to 10 characters — use the CSV output for full-length band names.
If a point falls outside the raster extent, the column value will be
NULL.
Requirements
QGIS 3.16 or later
Python 3.x (included with standard QGIS installation)
Libraries:
gdal,numpy(included with standard QGIS installation)