EE CHIRPS RainMapper is a lightweight, browser-based WebGIS tool built entirely inside the Google Earth Engine (GEE) Code Editor. It lets users draw or upload an Area of Interest (AOI) and instantly analyze rainfall accumulation and trends using the CHIRPS
A no-code Google Earth Engine App for exploring, analyzing, and downloading CHIRPS precipitation data through an interactive WebGIS interface.
Live App: https://
Author: Defani Arman Alfitriansyah Affiliation: Faculty of Forestry and Environment, Universitas Kuningan
Overview
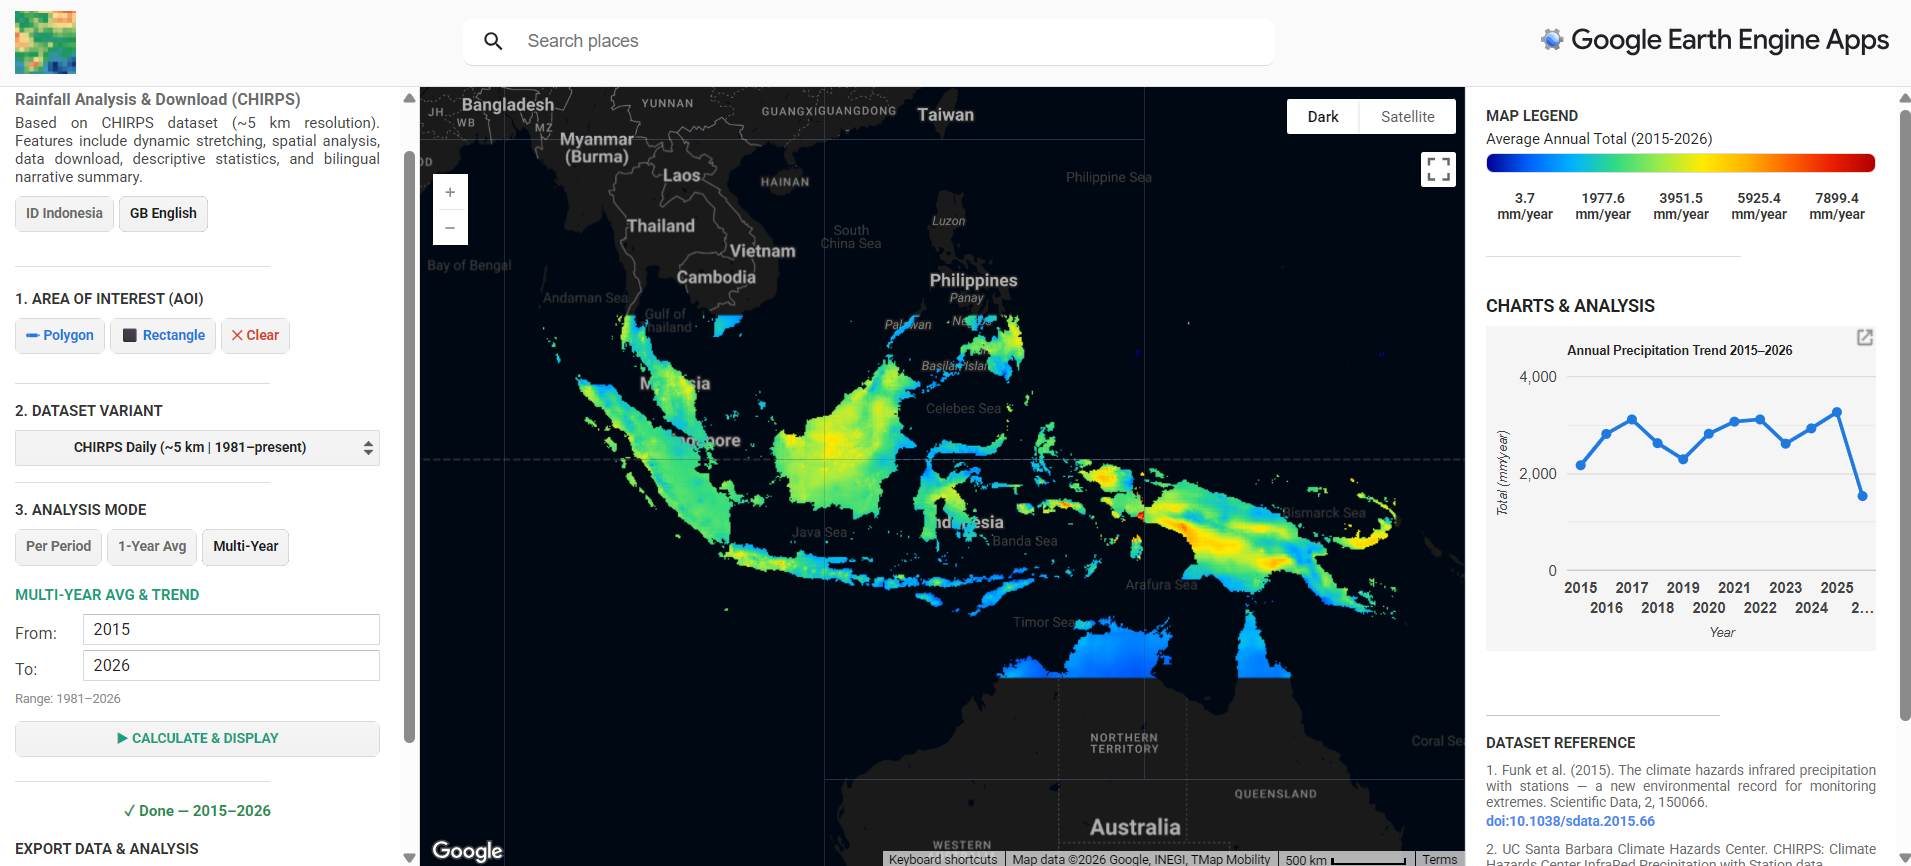
EE CHIRPS RainMapper is a Google Earth Engine (GEE) App built entirely with the ui module, designed to remove the friction of manually processing CHIRPS rainfall data (clipping to a region, summing over time, computing annual averages, and generating trend charts). All processing is handled server-side on GEE and delivered through a browser interface, without requiring the user to write or modify any code.
The app supports drawing a custom Area of Interest (AOI), selecting between CHIRPS Daily or Pentad datasets, running one of three analysis modes, and exporting results as GeoTIFF or chart-derived CSV. The interface is fully bilingual (English/Indonesian) and includes an automatically generated narrative summary comparing the selected period against a historical baseline.
Features
Custom AOI drawing — polygon or rectangle, drawn directly on the map, with a clear/reset option
Dataset selection — CHIRPS Daily (~5 km, 1981–present) or CHIRPS Pentad (~5 km, 1981–present)
Three analysis modes:
Per Period — total precipitation over a user-defined date range
1-Year Average — annual total plus a monthly precipitation trend chart
Multi-Year — multi-year average plus an interannual trend chart with linear trendline
Dynamic min/max stretching computed per AOI, using the official CHIRPS visualization palette
Descriptive statistics — mean, median, standard deviation, minimum, maximum, and AOI area, computed via
ee.ReducercombinationsAutomatic narrative summary — compares the selected period’s mean rainfall against a 1991–2020 historical baseline, generated in both English and Indonesian
Data export — GeoTIFF download via
getDownloadURL(), and chart data exportable as CSV/SVG/PNG through the built-in Google Charts menuBilingual interface — toggle between English and Indonesian without reloading the page, driven by a single translation dictionary
Dark basemap with light UI panels — custom Google Maps JSON style applied only to the basemap layer
System Workflow
Interface Layout
Technical Notes
Built using the GEE
uiAPI (ui.Map,ui.Panel,ui.Chart,ui.DateSlider) — no external frontend frameworkRainfall accumulation computed with
ImageCollection.sum()over the filtered date range, per modeMin/max values for map stretching are computed per AOI via
reduceRegion()withee.Reducer.minMax()rather than using fixed values, so the color scale adapts to each region and periodDescriptive statistics computed with a combined reducer chain (
mean,median,stdDev,min,max)Historical baseline fixed at 1991–2020 (or capped at
current year − 1if that range is unavailable), following the WMO convention for 30-year climate normalsAll UI text is centralized in a single translation dictionary (
T.en/T.id) referenced through atr(key)helper, allowing the interface to switch language without a page reload
Dataset Reference
Funk, C., Peterson, P., Landsfeld, M., Pedreros, D., Verdin, J., Shukla, S., Husak, G., Rowland, J., Harrison, L., Hoell, A., & Michaelsen, J. (2015). The climate hazards infrared precipitation with stations — a new environmental record for monitoring extremes. Scientific Data, 2, 150066. Funk et al. (2015)
UC Santa Barbara Climate Hazards Center. (n.d.). CHIRPS: Climate Hazards Center InfraRed Precipitation with Station data. https://
www .chc .ucsb .edu /data /chirps Google Earth Engine Data Catalog. UCSB-CHG/CHIRPS/DAILY: Climate Hazards Group InfraRed Precipitation with Station Data (CHIRPS). https://
developers .google .com /earth -engine /datasets /catalog /UCSB -CHG _CHIRPS _DAILY Google Earth Engine. UI Widgets Guide. https://
developers .google .com /earth -engine /guides /ui _widgets
Links
Live App: https://
defaniarman .users .earthengine .app /view /ee -chirps -rainmapper CHIRPS Data Portal: https://
www .chc .ucsb .edu /data /chirps GEE Dataset Catalog Entry: https://
developers .google .com /earth -engine /datasets /catalog /UCSB -CHG _CHIRPS _DAILY
- Funk, C., Peterson, P., Landsfeld, M., Pedreros, D., Verdin, J., Shukla, S., Husak, G., Rowland, J., Harrison, L., Hoell, A., & Michaelsen, J. (2015). The climate hazards infrared precipitation with stations—a new environmental record for monitoring extremes. Scientific Data, 2(1). 10.1038/sdata.2015.66