Cartographic layout designer for GeoLibre
Coba langsung: GeoLibre (Qiusheng Wu) berjalan di halaman ini. Buka Plugins → Marketplace, pasang Layout Composer, atau buka layar penuh.
Cartographic layout designer for GeoLibre. Design publication-ready maps in a Word-style workspace — map frames, coordinate grids, legends, matplotlib-style color bars, attribute tables and Plotly charts from your layers, Mermaid diagrams, LaTeX formulas, symbols and icon catalogs, GeoPDF export and QGIS template exchange — without leaving GeoLibre.















Author: Defani Arman Alfitriansyah · Repository: https://
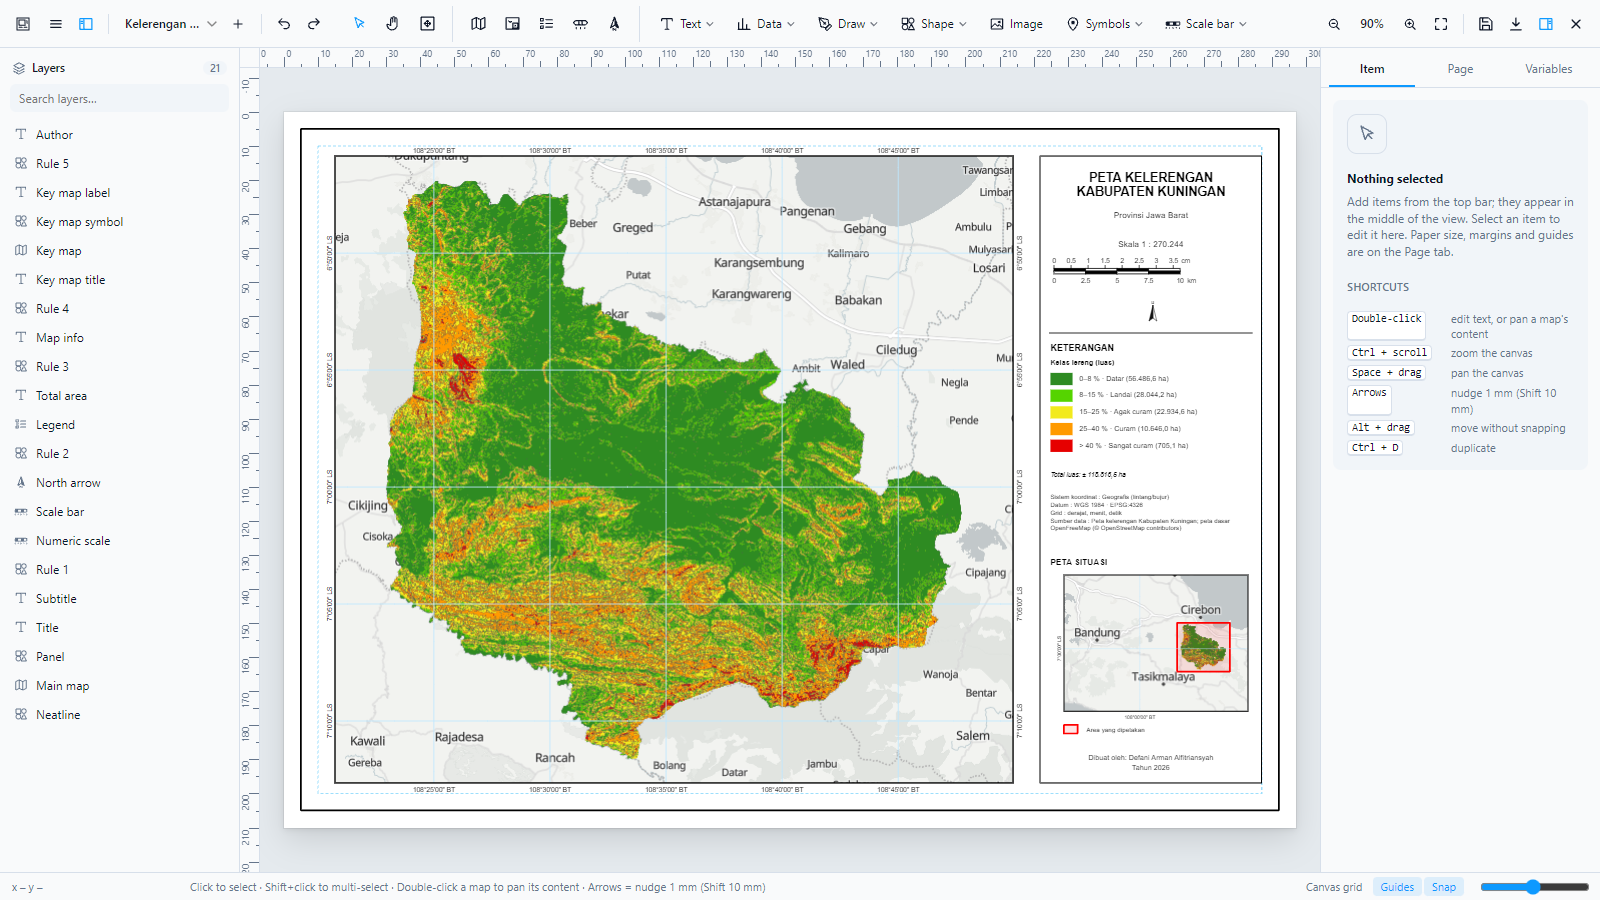
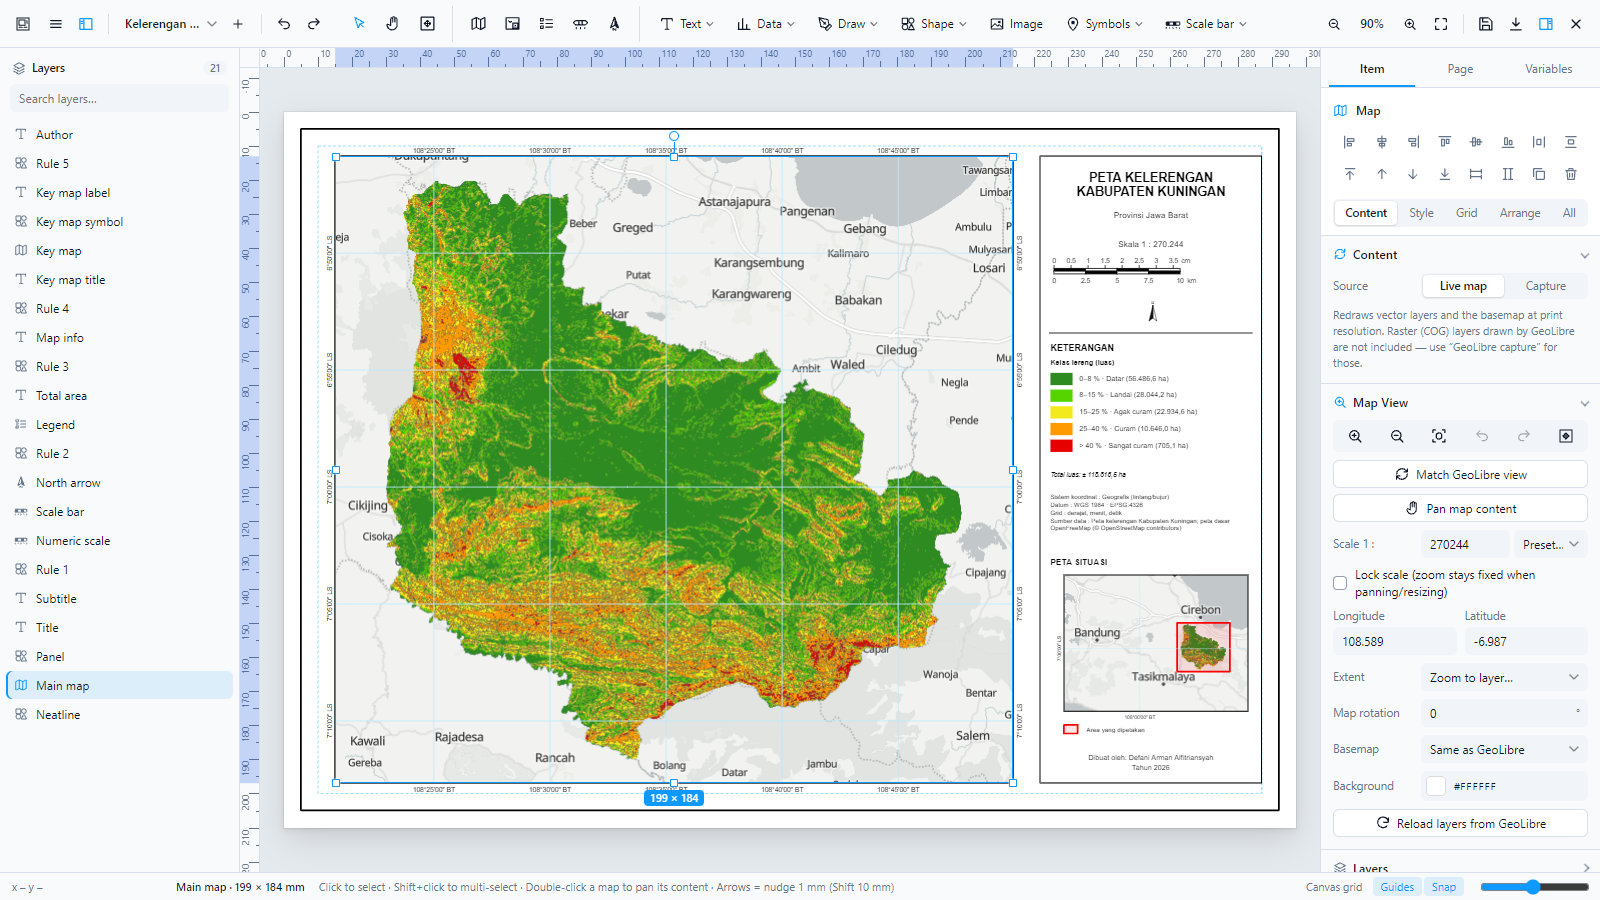
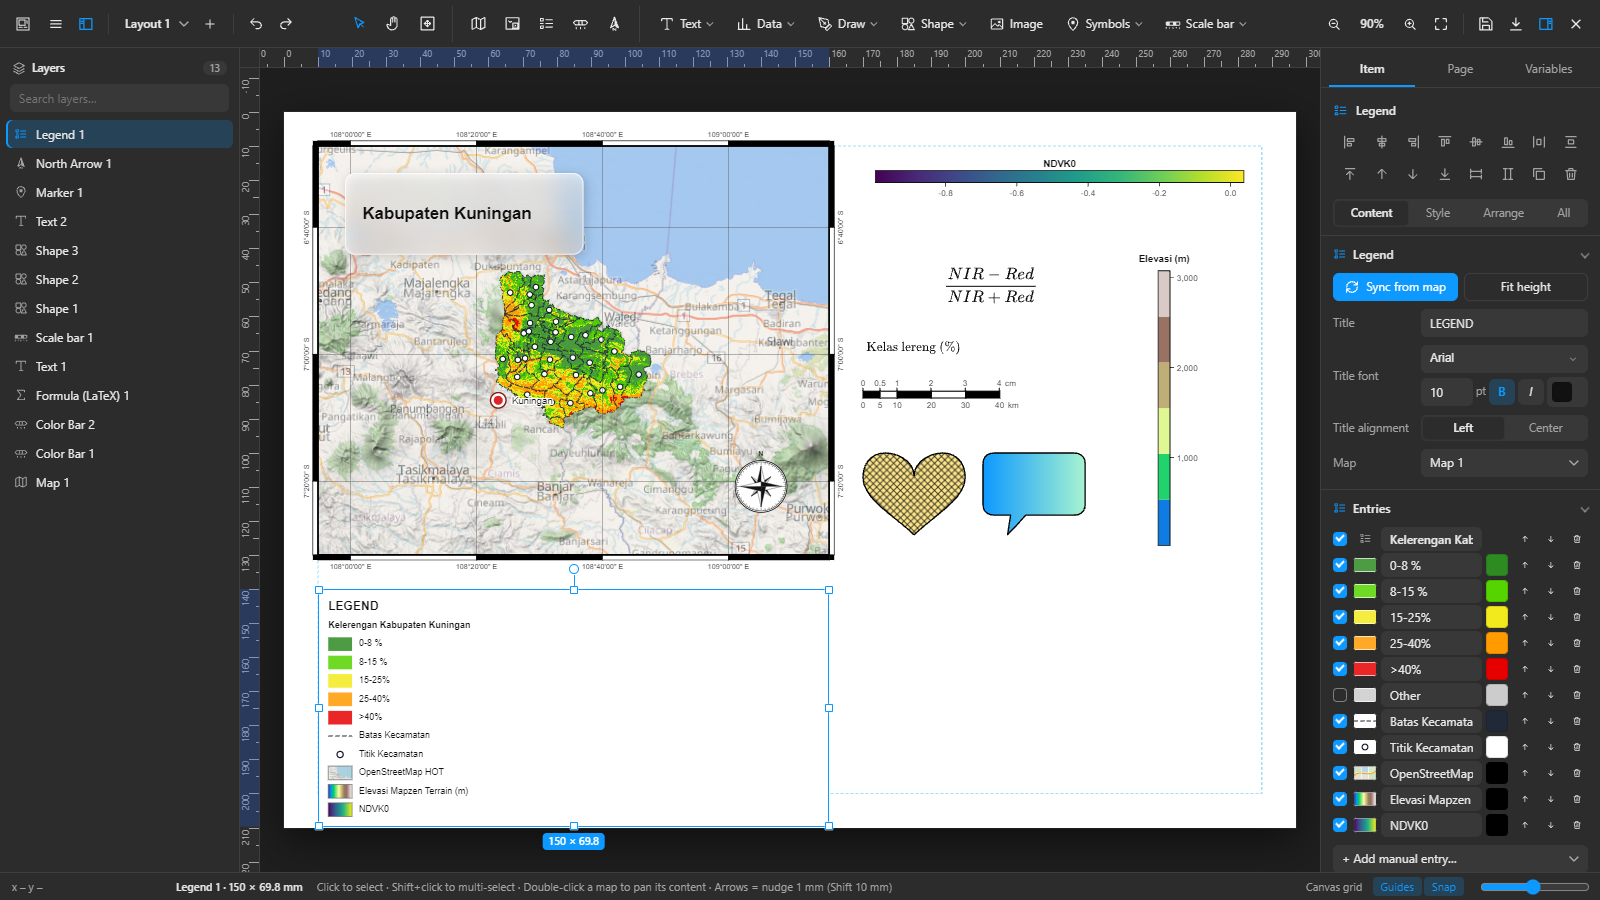
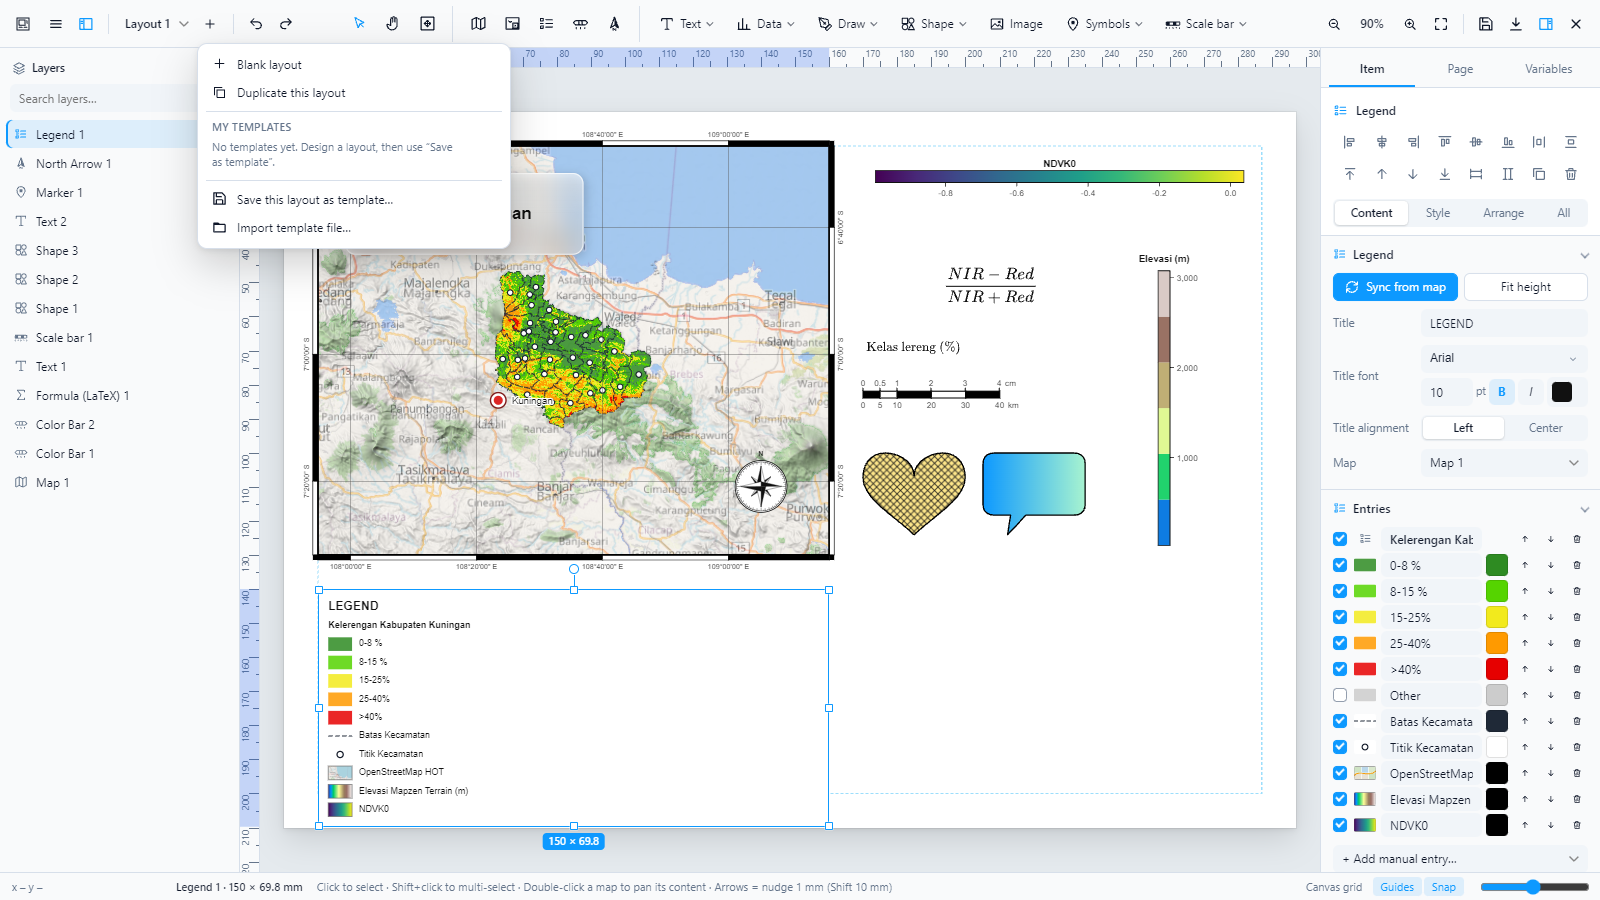
The editor with a slope map of Kabupaten Kuningan (West Java) made from real data. The layout file is in examples/; the exported page is shown under Example map.
Contents
Features
| Area | What you get |
|---|---|
| Workspace (new in 1.11) | A ribbon like Microsoft Word: the Insert tab holds every element as large buttons; the Format tab shows the selection’s settings in two-row groups with captions — no side panel needed, no scrollbar. Contextual tabs Table Design / Table Layout for tables and Map Frame / Grid for map frames. Layers open as a drop-down over the canvas (drag to reorder); the full property panel and Ask AI stay closed until opened, so the page gets the whole width. Page orientation, border, grid, guides, snap and the selection-frame look (color, solid / dashed / dotted, width) sit in the status bar. Canva / Figma-style drawing with a live size badge, proportional corner resize (text scales its lettering), and a Hand tool that moves the content of map frames. On the desktop app, Save and Export open a Save as dialog to pick the folder. |
| Text like Word | Font, size, grow / shrink, change case, clear formatting, bold, italic, six underline styles, strikethrough, sub / superscript, effects, highlight and font colors; bullets and numbering (1. · 1) · (1) · a. · a) · A. · i. · I. · 1.1) with a hanging indent, indent, sort, alignment incl. justify, line / paragraph spacing, shading, borders and a quick Styles gallery. Text boxes hug their text. A Symbol dialog with 28 Unicode subsets (incl. a Map & GIS set), symbol fonts, character codes, recent symbols and special characters. |
| Charts (Plotly) | Bundled Plotly.js: donut, pie, column, bar, line, area, dots, lollipop, bubble, funnel, funnel area, treemap, sunburst, icicle, rose, radar, waterfall, histogram, box, violin and heat strip; Plotly, White, Minimal, Seaborn, ggplot2 and Dark styles; data from a layer (count, area, length, sum or average per class, in the layer’s class colors) or typed rows; exported as vector SVG. |
| Diagrams & HTML | Mermaid diagrams (flowchart, sequence, Gantt, pie, mind map, timeline, class, state…) with templates and themes, drawn as plain SVG. HTML blocks with your own HTML + CSS (sanitised, CSS scoped to the box), redrawn as SVG for export. |
| Tables like Word | Header / total row, first / last column, banded rows / columns, 8 table styles, border style, width, pen color and which borders, shading; a cell editor that inserts or deletes rows and columns at the chosen cell; AutoFit, distribute columns, 3 × 3 alignment, cell margins. |
| Map Series (atlas) | One layout, one page per feature of an index layer: the map frame zooms to each feature (or keeps its scale), text uses {series_name}, {series_page}, {series_count}, {series:FIELD}; page navigation in the ribbon and status bar; export the whole series as one multi-page PDF or one image per page. |
| Category Colors | Colour a GeoLibre layer by class from its own data: Distinct 200 (non-gradient), official KLHK class colours, Plotly, Tableau, ColorBrewer; opacity 100 % by default, outline, per-class edits; saved with the project and followed by the legends. |
| Map Tools | A Map Tools submenu of the Layout Composer menu (and a ribbon over the map) with the workflows of ArcGIS Pro Map Fundamentals: coordinates in DD · DMS · DDM · UTM · MGRS (typed or pasted in any format, conversion window, right-click copy with a custom template, cursor readout); go to coordinate, zoom to scale or layer; points, lines and polygons from coordinate lists, CSV / spreadsheet rows, WKT or GeoJSON — into a new or an existing layer; move or delete selected features; map chips as PNG + world file; image footprints and images covering a point. |
| Pictures | From a file or from a link; Remove background with remove.bg (your own API key); fit, fill, stretch, opacity, border, filters and masks. |
| Page | Size catalog grouped by type — ISO A0–A6, ISO B0–B5, Letter/Legal/Tabloid/ANSI/Arch, F4, Indonesian minimum sizes per map scale, posters, photo prints, presentation (16:9, 4:3, 16:10, 4K) and social media (Instagram post/portrait/story, TikTok/Reels, Facebook, X, LinkedIn, YouTube, Pinterest, WhatsApp). Units mm · cm · in · pt · px (px at a chosen pixels-per-inch), orientation, single/double neatline, margins, canvas grid, ruler guides, smart snapping. |
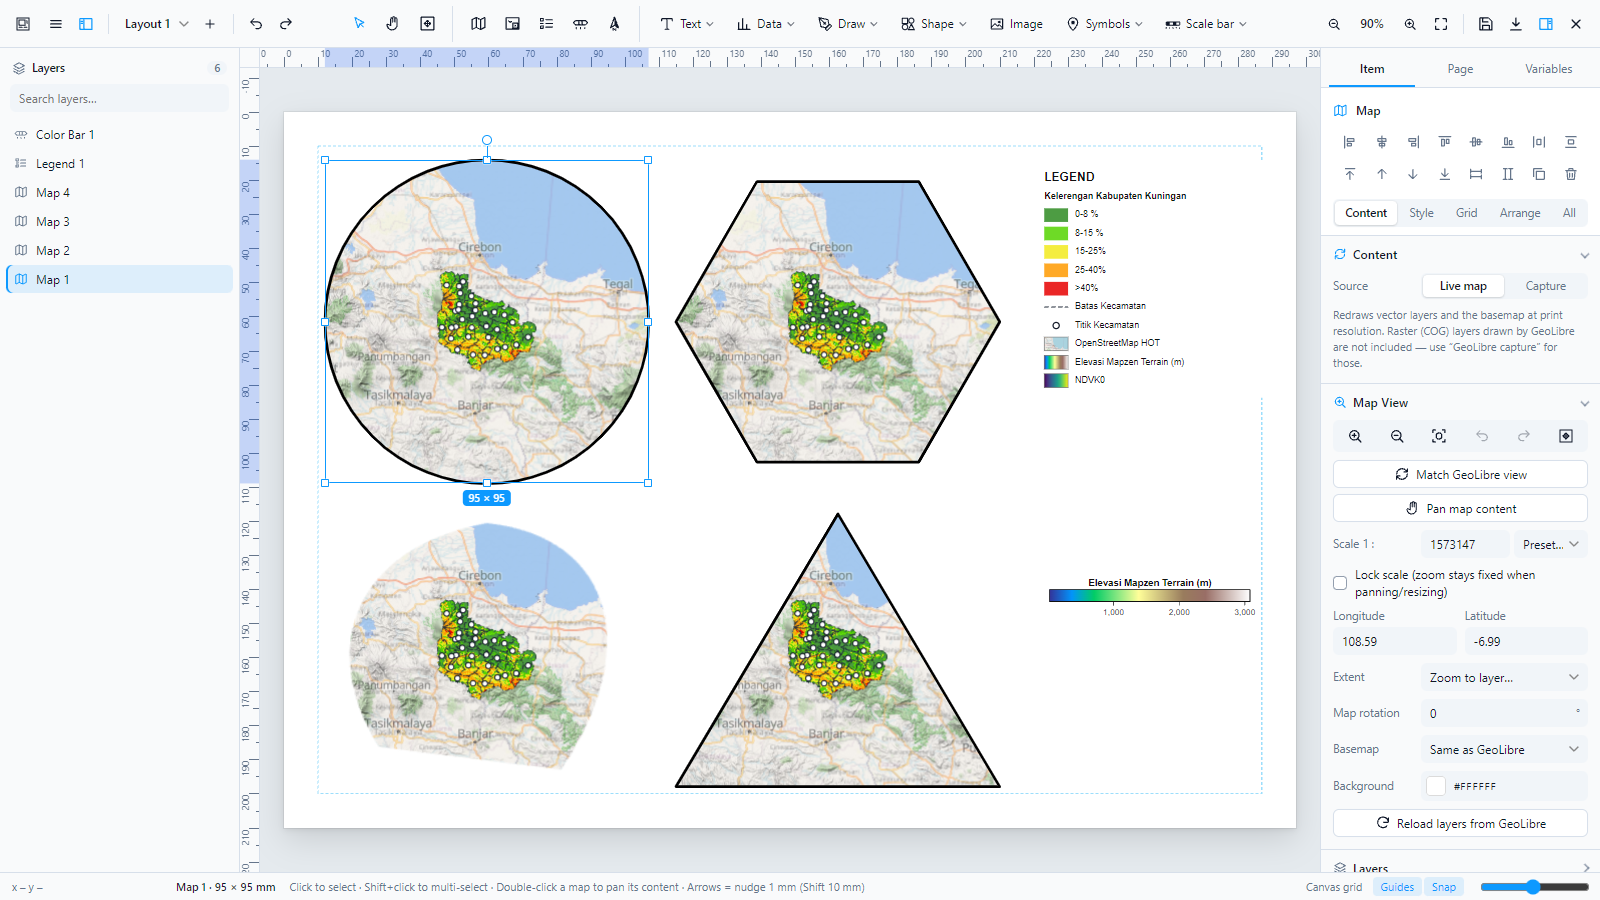
| Map frames | Live MapLibre map per frame, WYSIWYG at print scale, pan/zoom content (double-click), set or lock scale 1:n, rotation, zoom to layer, per-frame basemap (same as GeoLibre, streets, light, bright, satellite, topographic, none), GeoLibre capture mode that includes raster/COG layers.; frame shapes: rectangle, rounded, circle/ellipse, triangle, diamond, pentagon, hexagon, octagon, star, heart, shield, arch, or any image as a mask (PNG/SVG silhouette).; layers per frame: each frame shows its own set of GeoLibre layers (e.g. an inset with only the boundary), and linked legends follow. |
| Coordinate grids | DMS · DM · DD · UTM (m or km, auto zone), lines/crosses/dots, zebra or inside/outside ticks, labels inside/outside, BT/LS or E/W–N/S. |
| Inset / key maps | Extent box, location point or crosshair of another frame. |
| Legend | Built from GeoLibre symbology (match, step, interpolate), single-band rasters/COG as colormap ramps, XYZ / WMS tile layers with a thumbnail of the actual tile, editable labels/colors/order, manual entries, multi-column, LaTeX labels. |
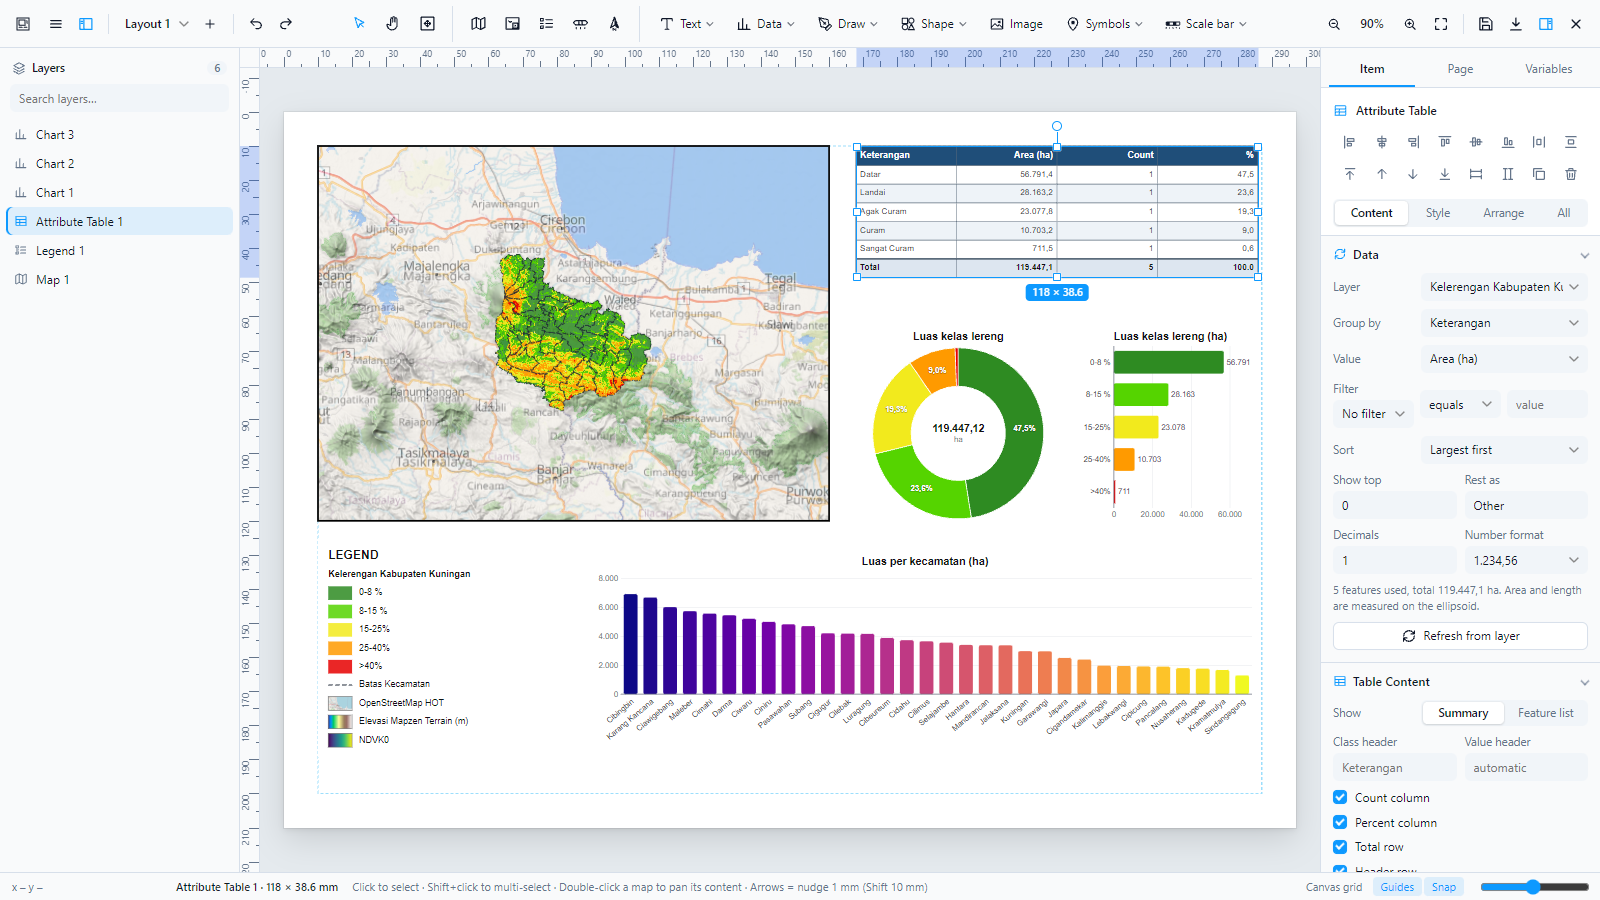
| Attribute tables | Built from a layer’s features: summary by class (area in ha or km², length in km, count, sum or average of a field, with count and percent columns and a total row) or a feature list with chosen columns; filter (=, ≠, >, <, contains), sort, top N with “Other”, decimals and number format (1,234.56 or 1.234,56). Area and length are measured on the ellipsoid. Values update when the data changes. |
| Charts | Pie, donut (total in the centre), column and bar charts with the same data options; colors from the layer’s GeoLibre symbology, a palette or one color; labels as percent, value or class; legend beside the chart; axis ticks that never overlap. |
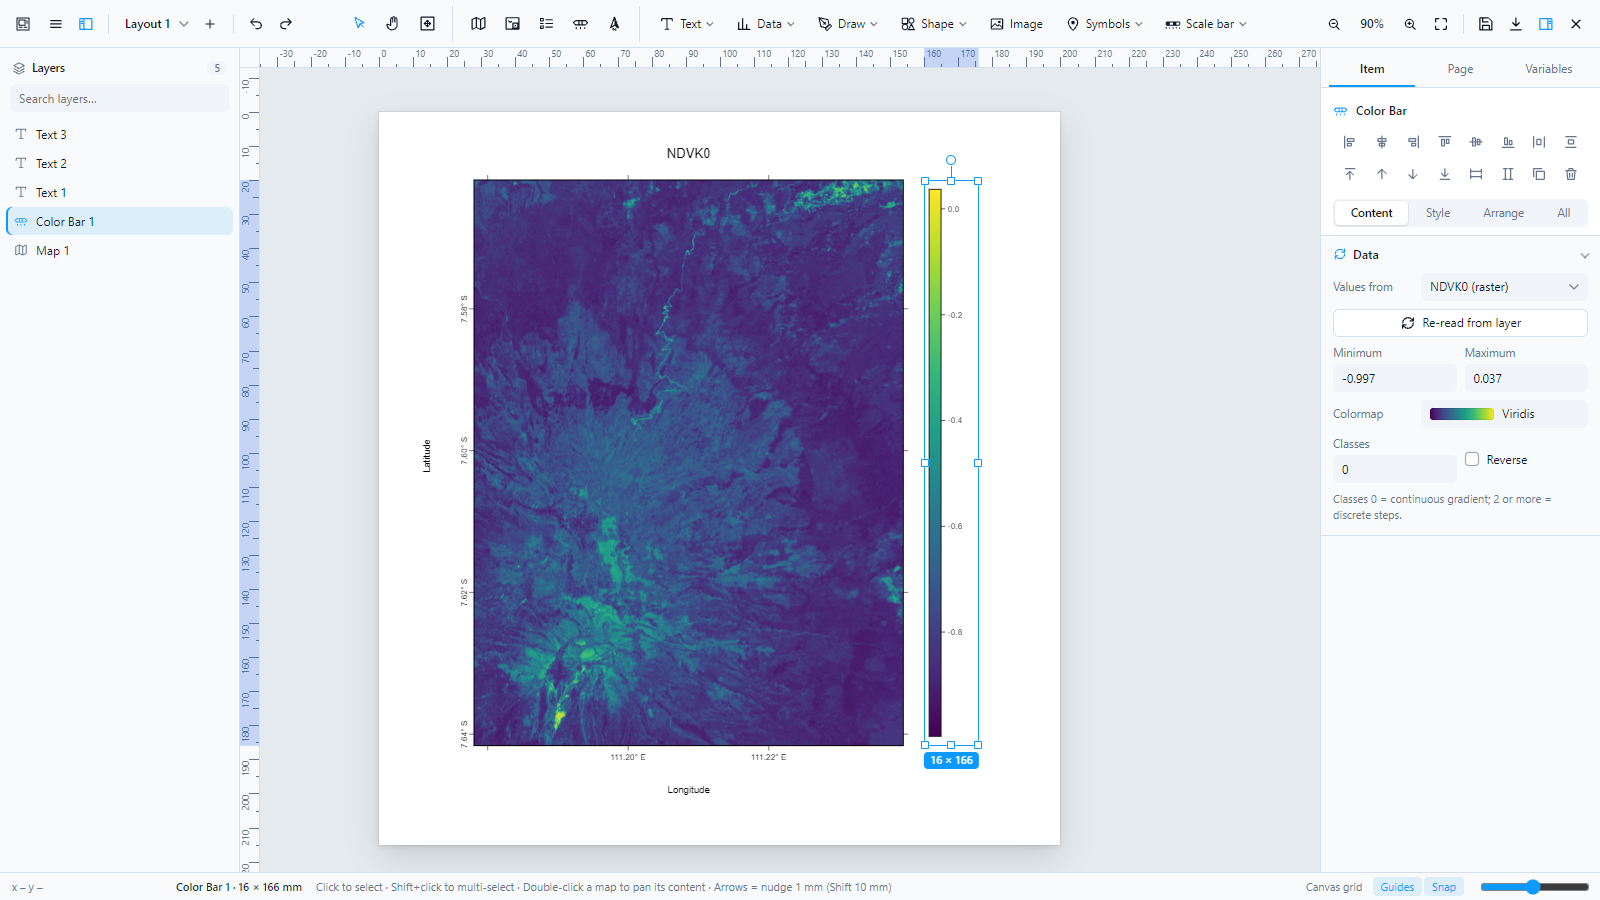
| Color bar | matplotlib-style: 39 colormaps + custom colors, reverse, continuous or classed, horizontal/vertical, pointed or square extensions (min/max/both), even/rounded/custom ticks with tick count, decimals, prefix/suffix, LaTeX title, reads min/max/colormap from GeoLibre raster (rasterState.rescale) or graduated layers.; values from a raster: min/max and colormap (incl. _r reversed) read from the layer’s stretch or statistics, with round tick values. |
| Scale bars | 11 styles incl. dual units — by default the KLHK / topographic layout: round paper centimetres on top, kilometres below at the same ticks, every 0 aligned on the left, equal segments (first segment split on request) — numeric 1:n. |
| North arrows | 26 styles plus your own PNG / SVG (kept in a reusable library), follow map rotation, letter U/N with adjustable size. |
| Canva-style editing | One click adds any item at the centre of the view (no box to draw); double-click or Enter edits text right on the page; text presets (heading, subheading, body, caption, map label, callout); text effects (shadow, lift, hollow, outline, highlight, neon, echo) and underline/strike/overline; flip horizontal/vertical for every item; image filters (brightness, contrast, saturation, grayscale, sepia, hue, blur + presets Mono, Vivid, Warm, Faded, Dramatic) and masks (circle, hexagon, star, heart, blob). |
| Text & LaTeX | Text boxes with variables ({title}, {date}, {scale}…), $…$ math anywhere (text, legend, color bar title, markers), formula item with 104-symbol catalog, structure templates and recent formulas (MathJax 3, vector output). Quick text bar: font (incl. installed fonts), size, bold, italic, color, alignment, superscript/subscript.; fonts: a searchable font picker with every Google Font (about 2,000 families, filter by sans, serif, display, script, mono, previewed in their own face) plus the fonts installed on your computer. Google Fonts are embedded in PNG, JPG, PDF and SVG exports.; typography: weight 100 to 900 (the weights each Google font really has), size, color and opacity, italic, small caps, underline, strikethrough, case, line height, letter spacing, paragraph gap, padding, left / centre / right / justified alignment, vertical alignment, and auto size (fixed box, auto height, or auto width). |
| Drawing | Polyline, polygon, Bézier pen (click = corner, drag = curve), freehand (simplified + smoothed), arrow line; 33 shapes; fills: solid, gradient, hatch patterns (/ \ × − | + ·); 6 dash styles. |
| Symbols | Point markers with labels (12 symbols); icon catalog with Maki (215) and Temaki (557) icons grouped by type (water, terrain, vegetation, transport, public services, health, education, religion, tourism, sports, utilities, hazards…) and Google Material Symbols (3,912 icons in 17 categories: maps, travel, transit, home, business…) in outlined, rounded or sharp style, regular or filled. The catalog searches as you type and loads icons in batches, and placed icons are stored in the layout so they work offline. |
| Effects | Drop shadow and frosted glass (blurs the map behind; reproduced in exports) on any item. |
| Editing | Minimal desktop-style workspace: every tool sits in the top bar (main menu and layout picker on the left; tools, map elements and insert menus in the centre; zoom, save and export on the right), outline icons that follow the light or dark theme, a full-height Layers panel, and an align, distribute and order bar at the top of the properties panel. Item properties grouped into Content, Style, Grid and Arrange tabs (or All); top-bar insert menus (Text, Draw, Shape, Image, Symbols, Scale bar), floating contextual toolbar for text and shapes, map navigation in the map panel (zoom in/out, fit layers, zoom to layer, previous/next extent), Move-content tool, collapsible left/right docks, item search, Figma-style selection (handles, rotation knob, size badge), hover outlines, multi-select, groups, align/distribute, lock/hide, rename, context menu, undo/redo, copy/paste, layers list. Round color wheel with brightness, hex, eyedropper, palette and recent colors. Light theme and soft neutral dark theme that follow GeoLibre.; precise position and size in mm, cm, in, pt or px, with a QGIS-style 9-point reference point, lock aspect ratio and ±90° rotation buttons. |
| Grid design | Canvas grid with spacing, major lines every N, lines or dots, color and opacity; layout grid like Figma (columns and rows with gutters and margin, shown on screen only, items snap to the edges); ruler guides plus guides at an exact position, guide color; adjustable snap distance and arrow-key nudge steps. |
| Layouts & templates | Several layouts per project, autosave, save/open .layout.json, save your own templates and start new layouts from them (maps re-framed on the current GeoLibre view). |
| QGIS templates | Export as .qpt: labels, map frames (extent, rotation, CRS EPSG:3857, DMS/DD/UTM grid with zebra frame), pictures, shapes, scale bars and legends become native QGIS items linked to their map; items QGIS has no equivalent for (color bars, charts, tables, north arrows, LaTeX, icons, drawings) are embedded as SVG pictures, so the page looks the same. Import .qpt from QGIS 3: page size, labels, maps (extents in EPSG:3857, EPSG:4326, WGS 84 / UTM and DGN95 / UTM), pictures, shapes, scale bars, legends, polylines and polygons. Checked by loading and rendering exported files in QGIS 3.44. |
| Export | PNG/JPG (75–600 dpi, page/white/transparent background), raster PDF, vector PDF, GeoPDF (every map frame georeferenced, WGS 84), SVG.; export settings open in their own window and a progress bar fills from left to right while maps render. |
Screenshots
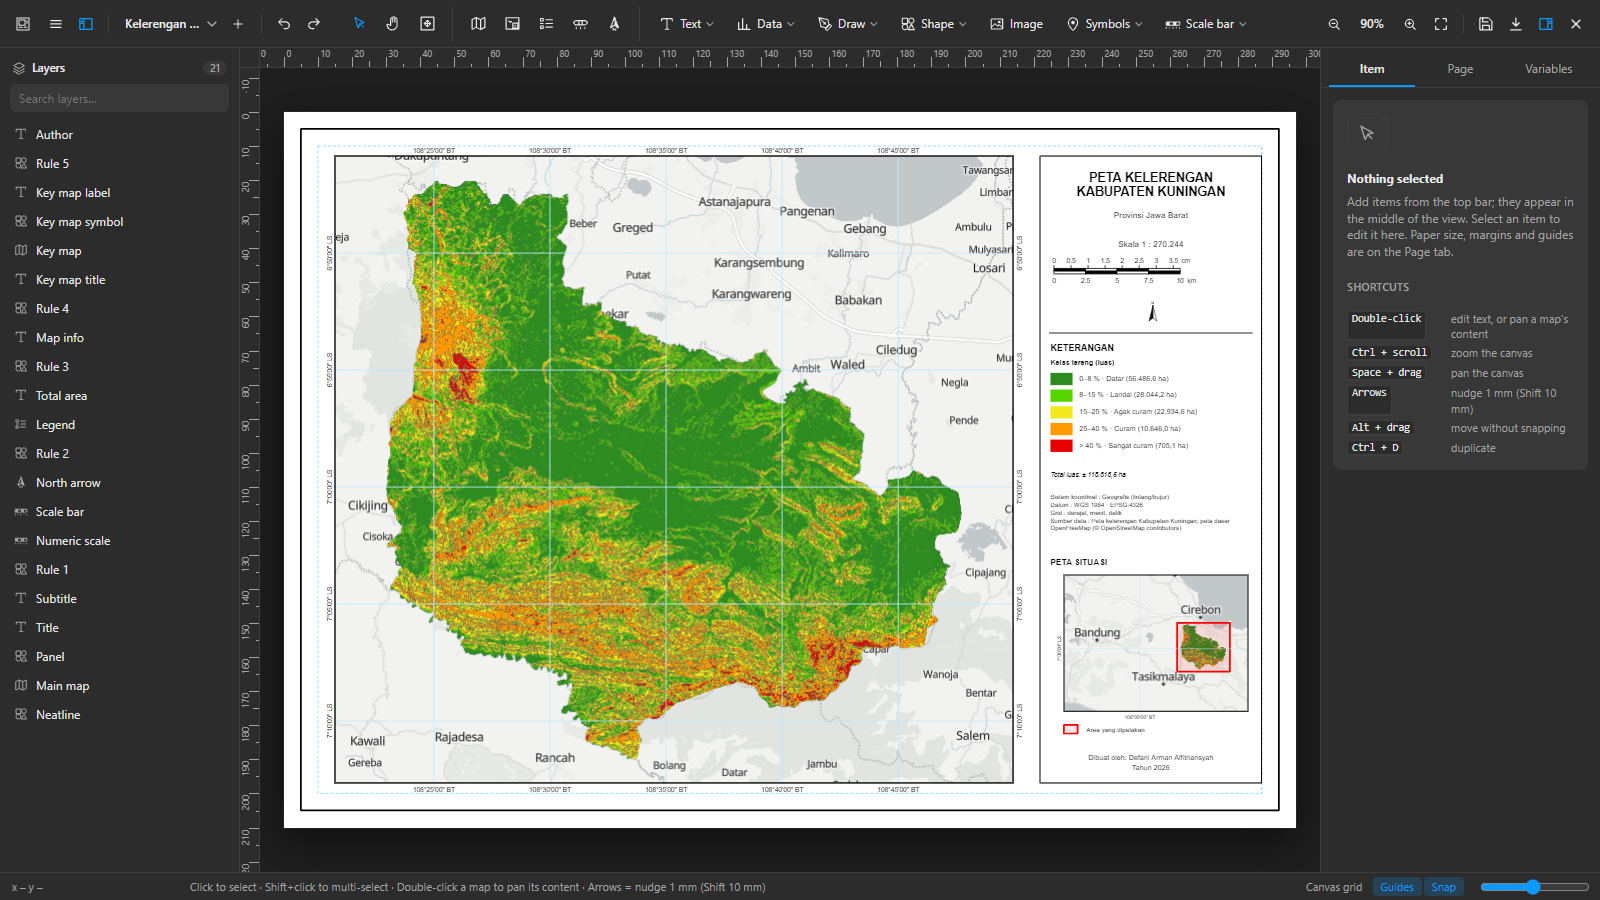 | 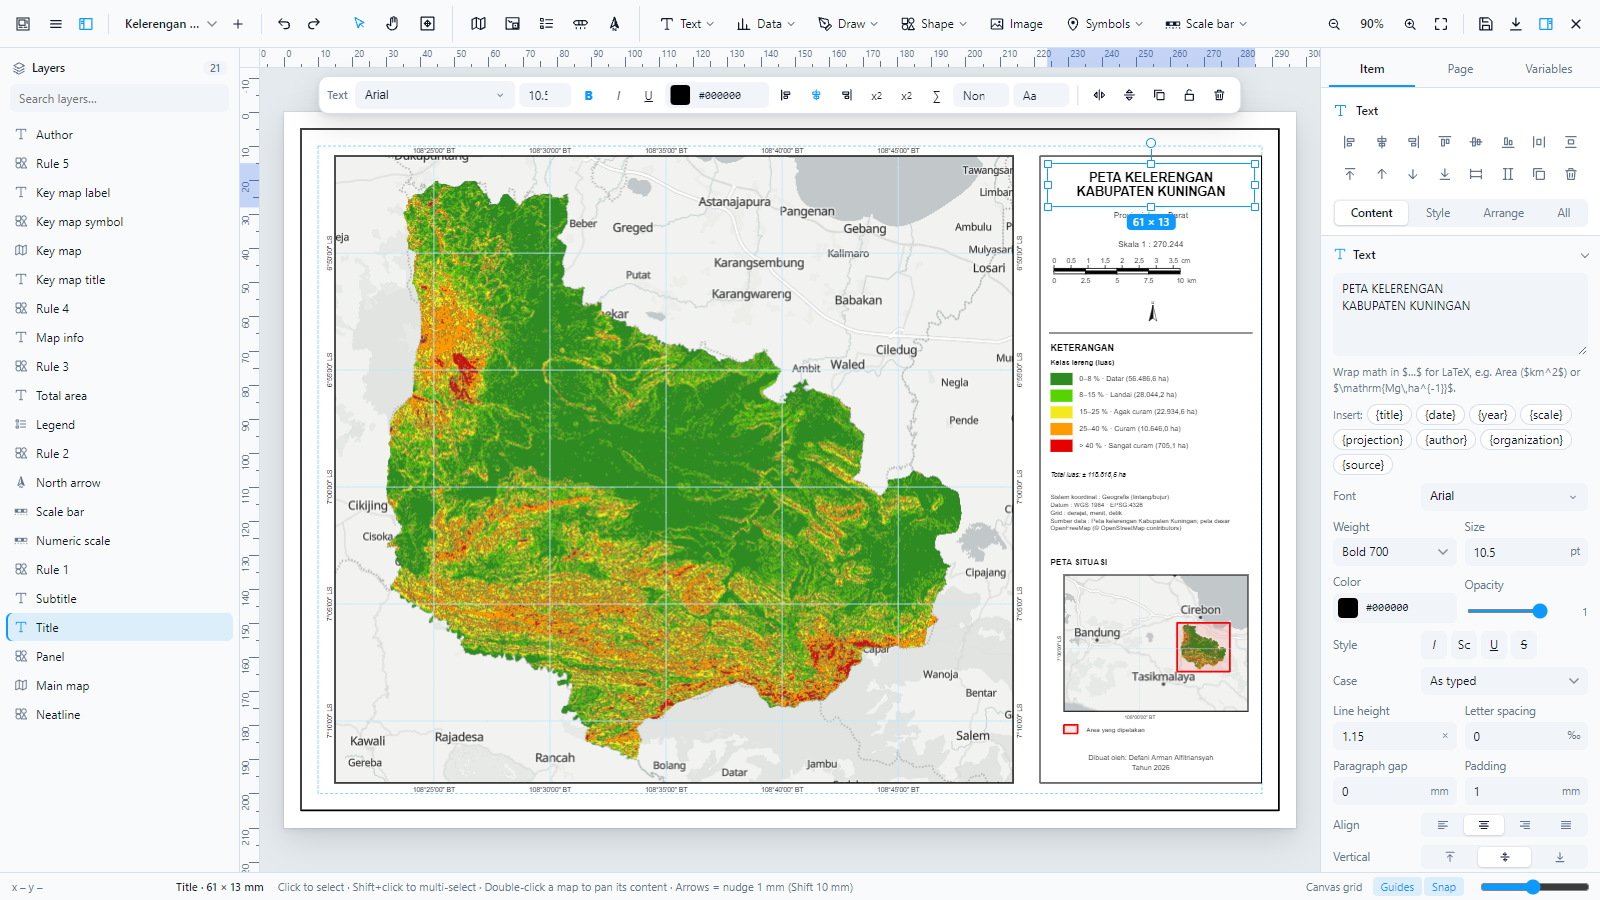 |
| Soft dark theme | Floating text toolbar |
 |  |
| Map frame panel: navigation, scale, basemap, grid | matplotlib-style color bar |
 |  |
| Map frame shapes, image mask, tile & raster legend | Attribute table from a layer |
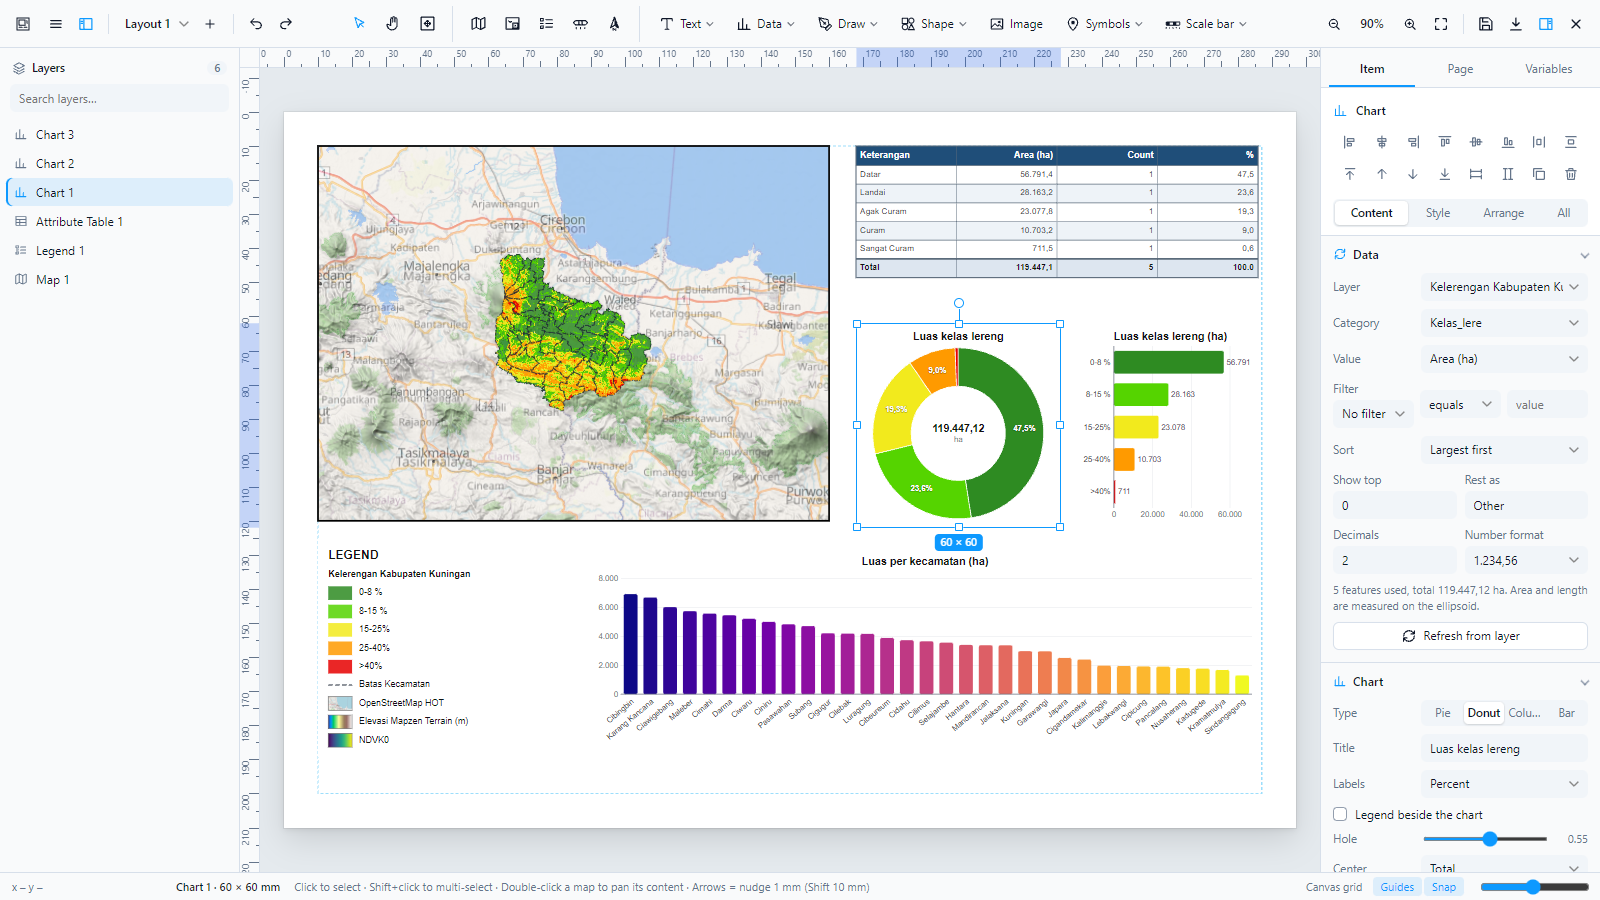 | 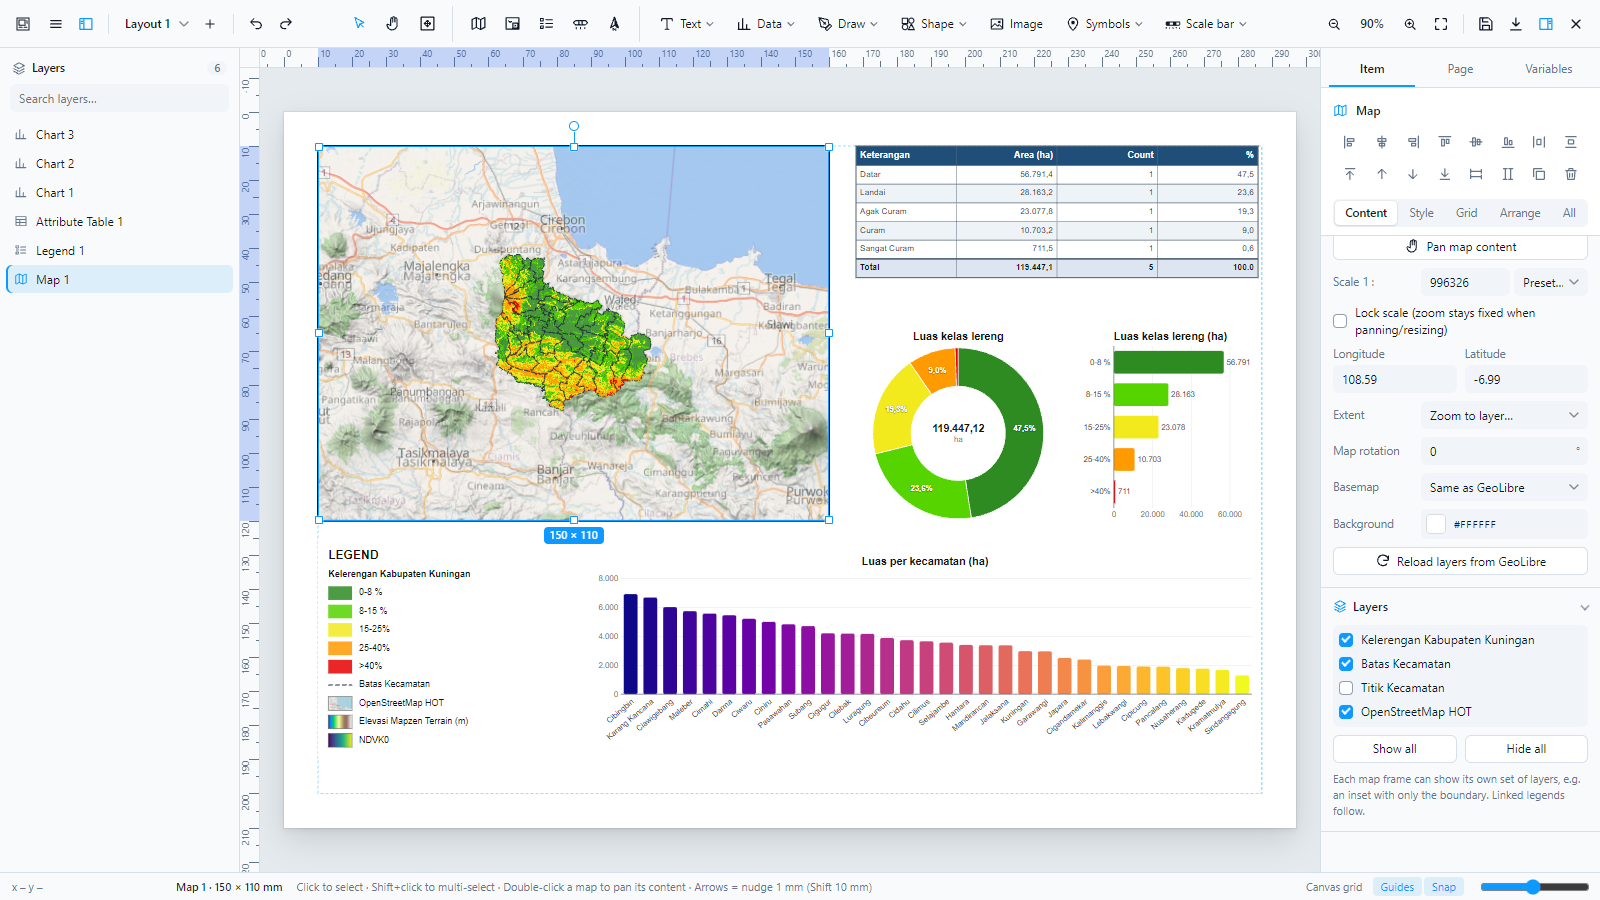 |
| Donut, bar and column charts | Layers per map frame, legend follows |
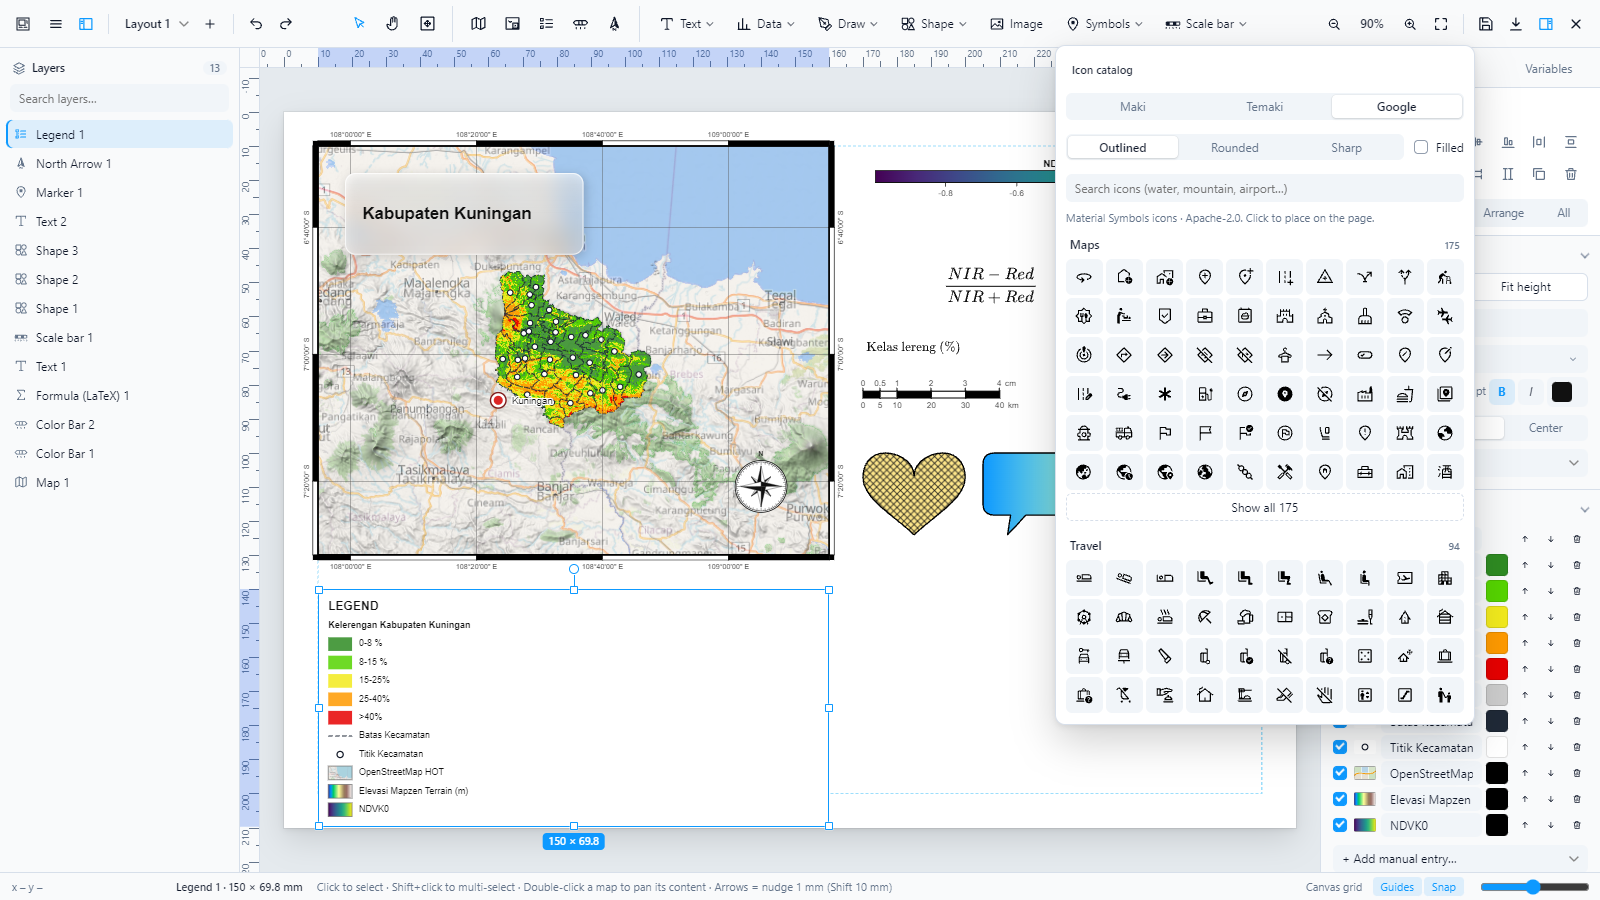 | 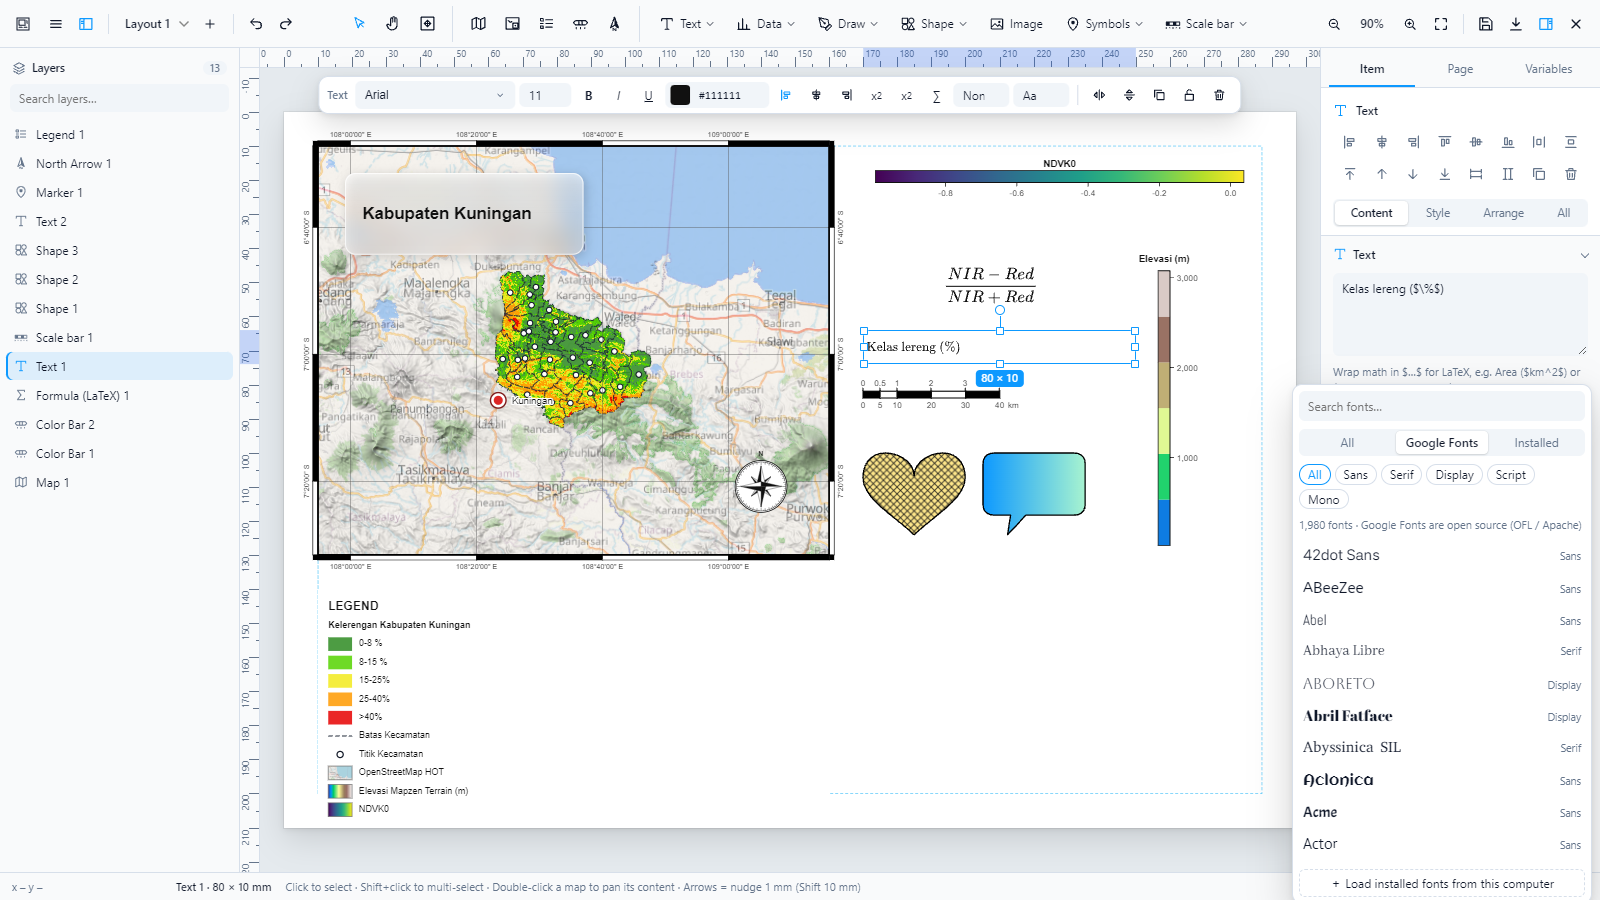 |
| Google Material Symbols in the icon catalog | Font picker with every Google Font |
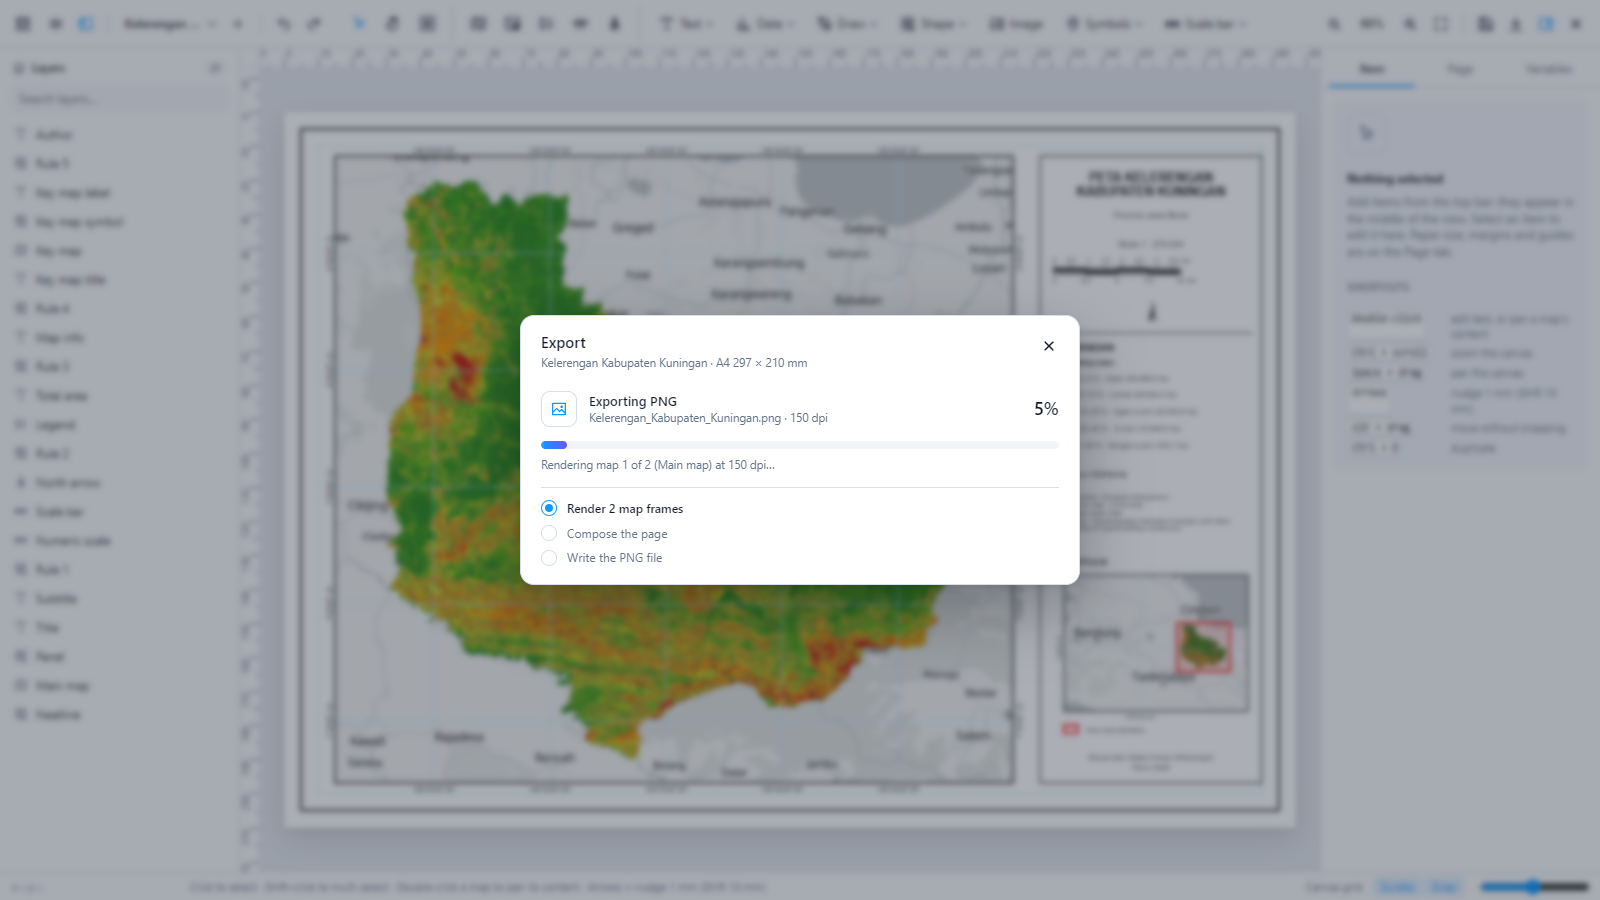 | 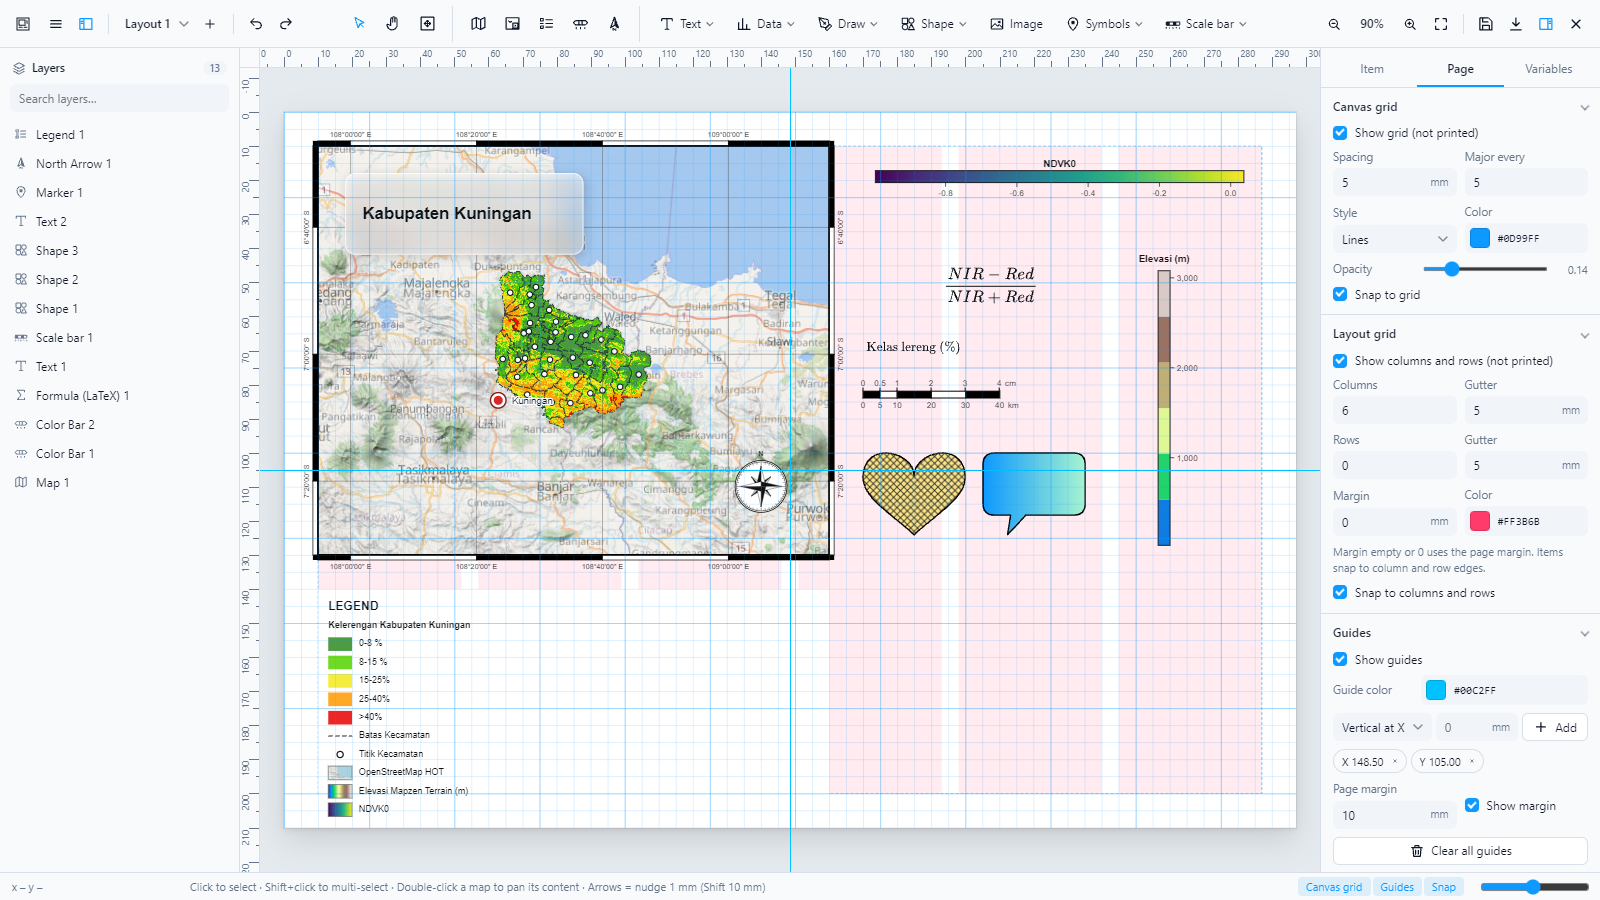 |
| Export window: progress from left to right, with steps | Grid design: canvas grid, layout grid, guides |
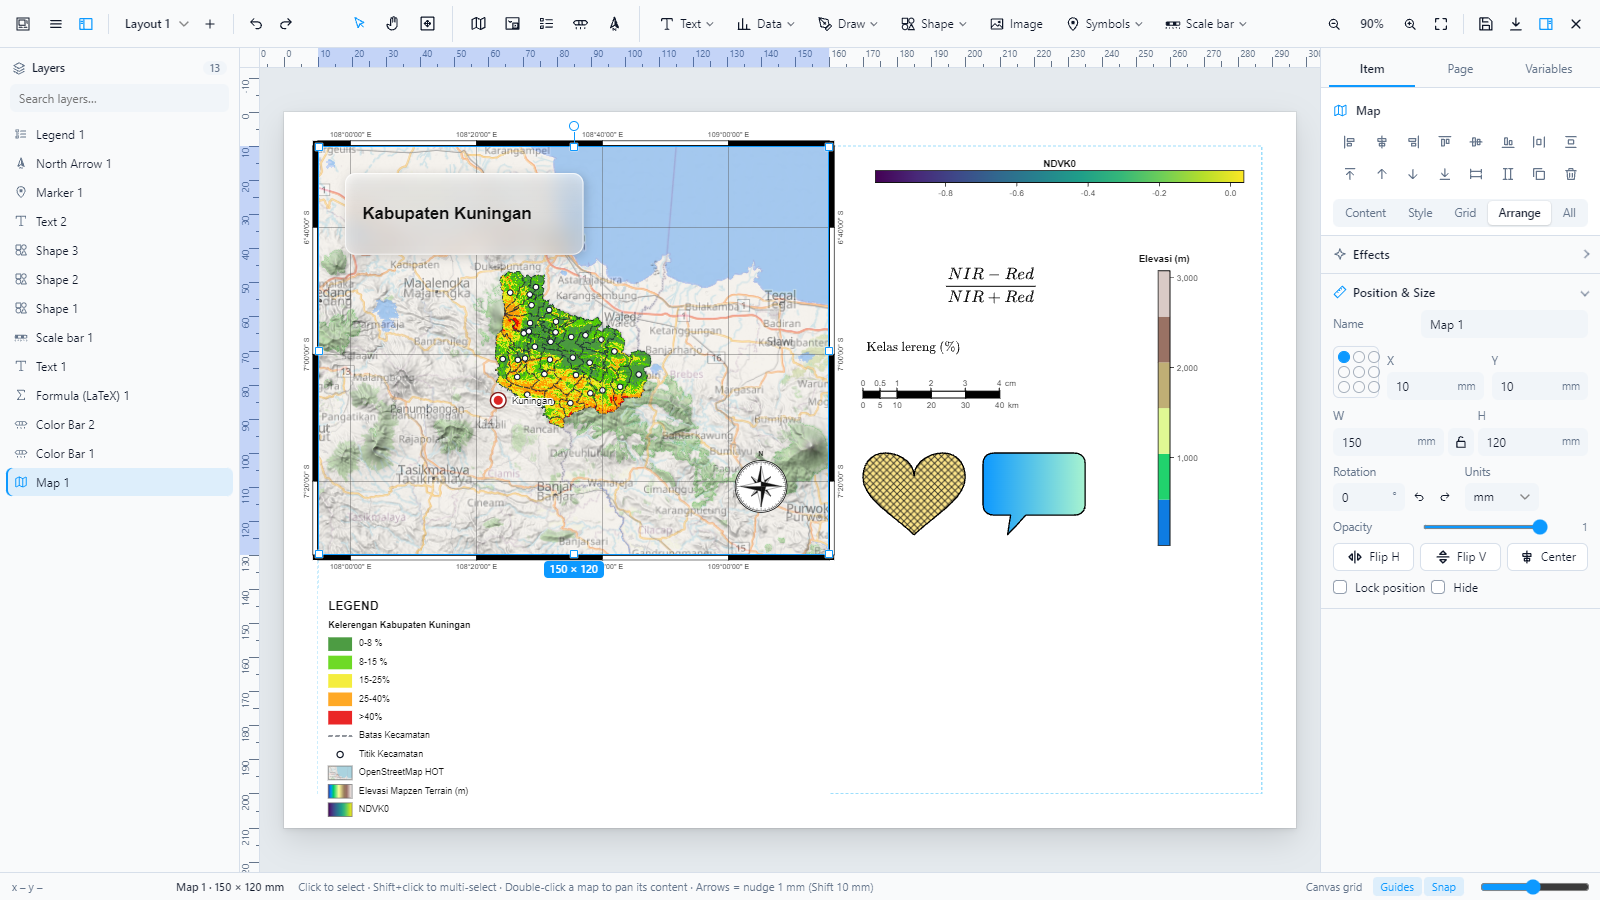 | 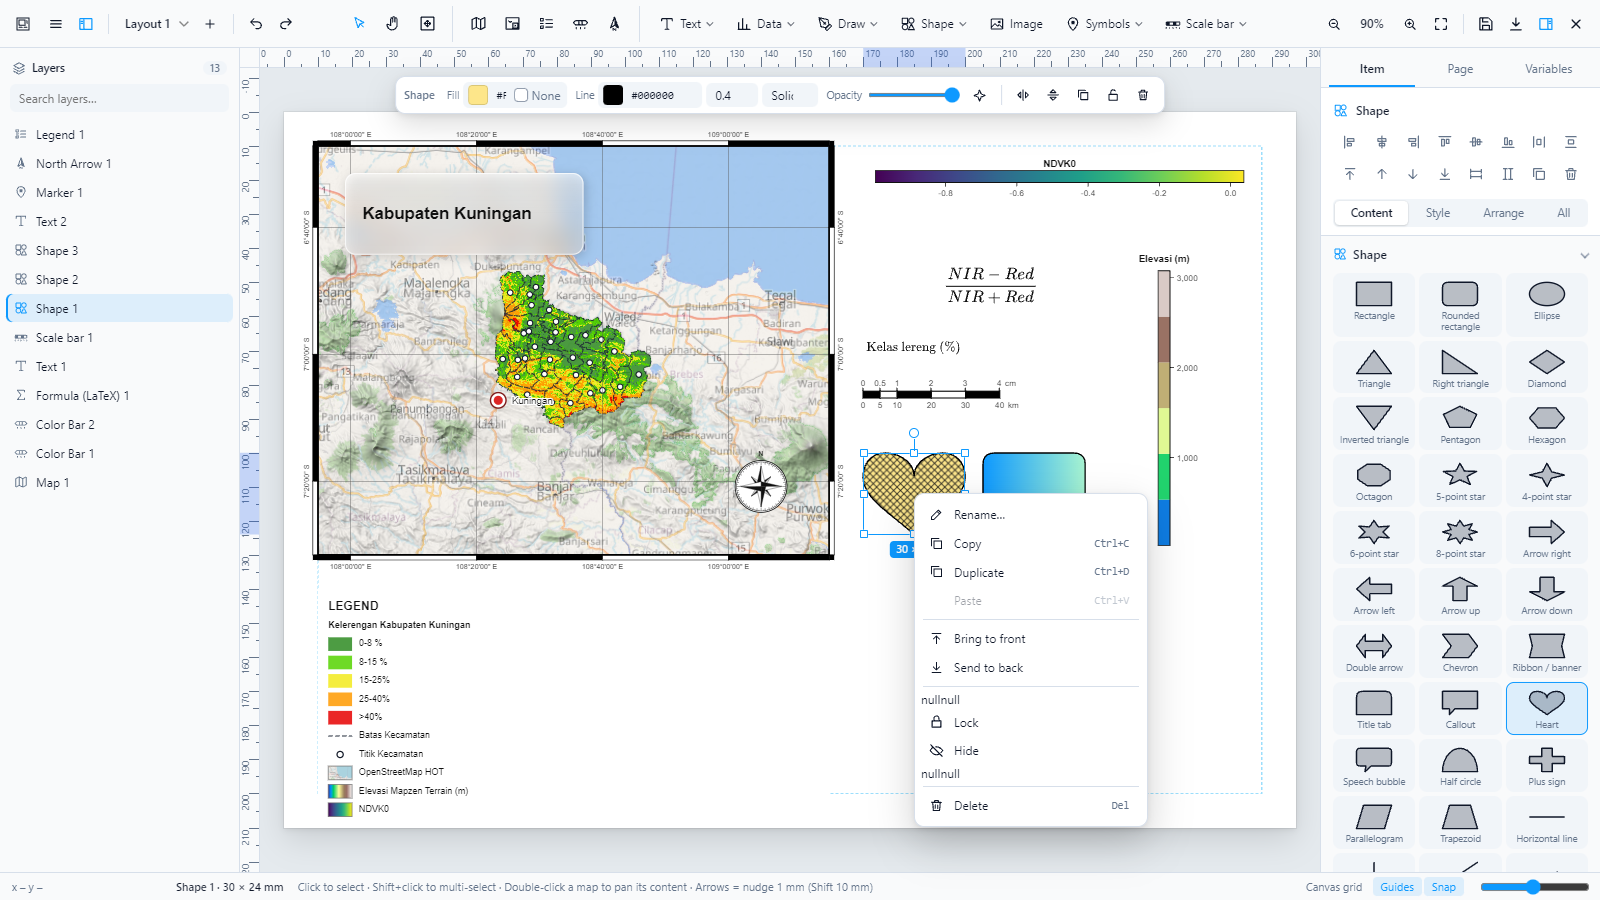 |
| Precise position and size with reference point and units | Context menu |
 | 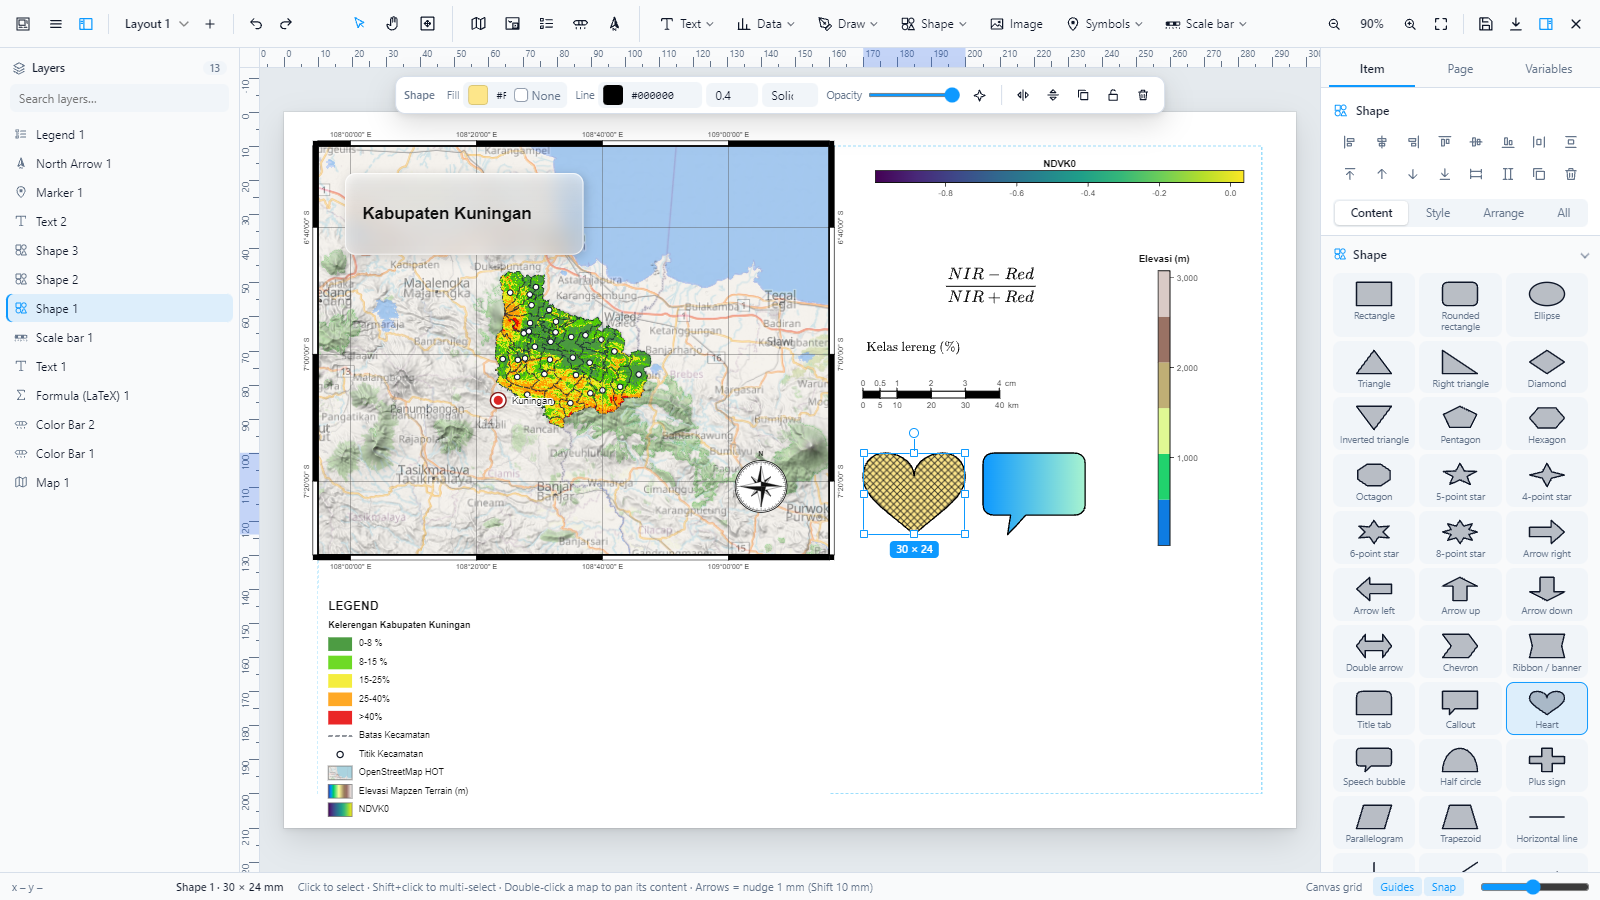 |
| LaTeX, dual scale bar, hatch & gradient fills, frosted glass | Shape toolbar |
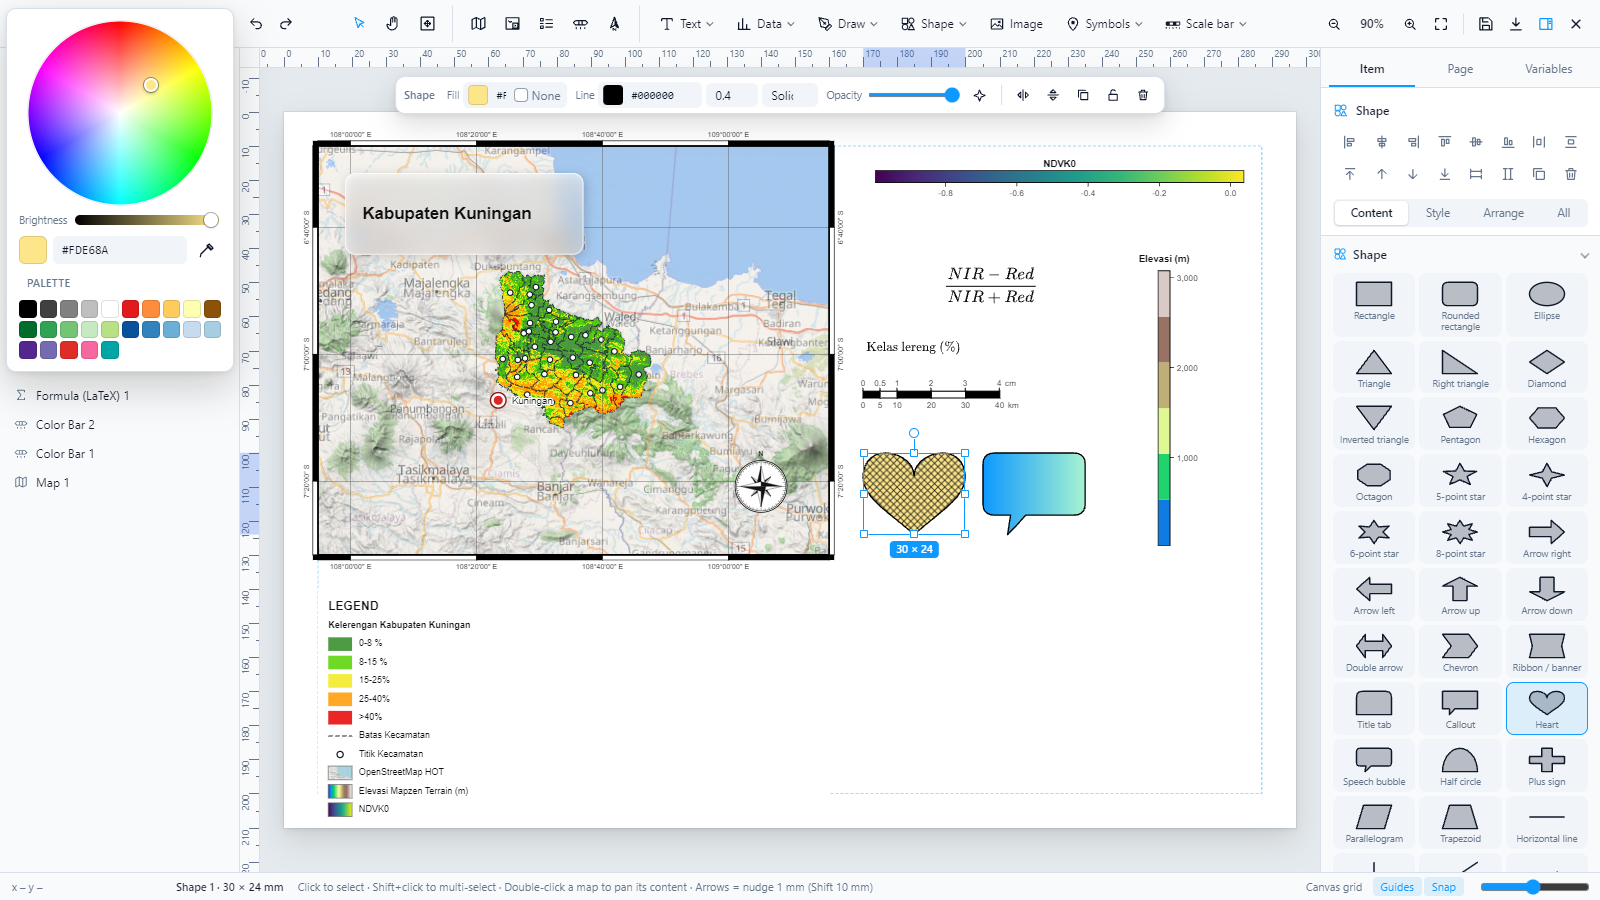 | 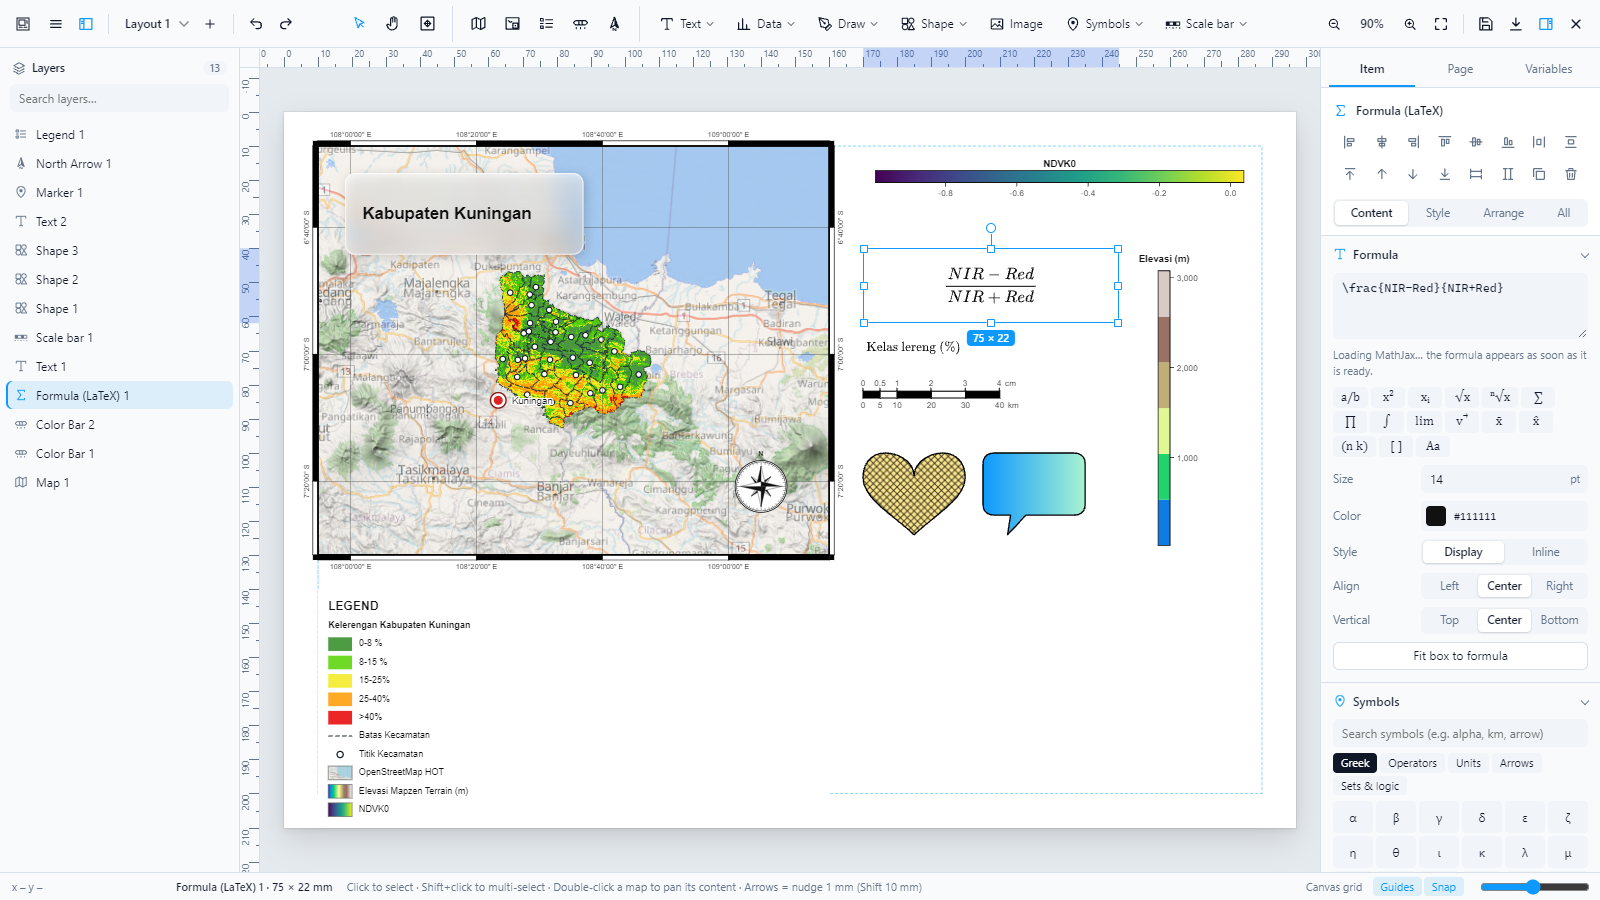 |
| Color wheel | LaTeX formula and symbol catalog |
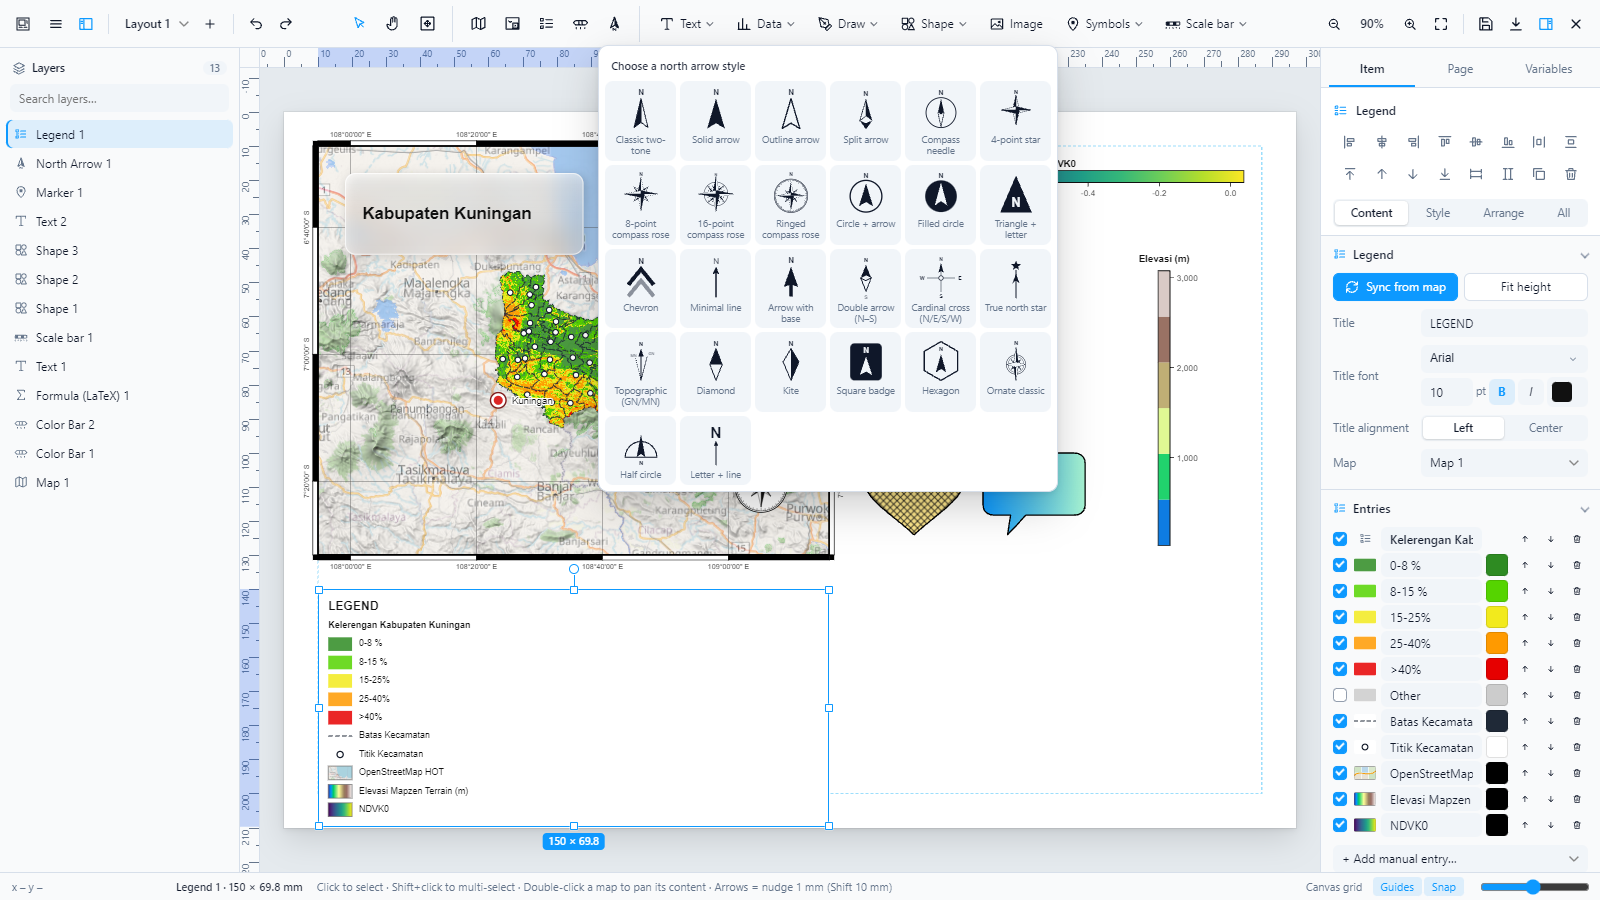 | 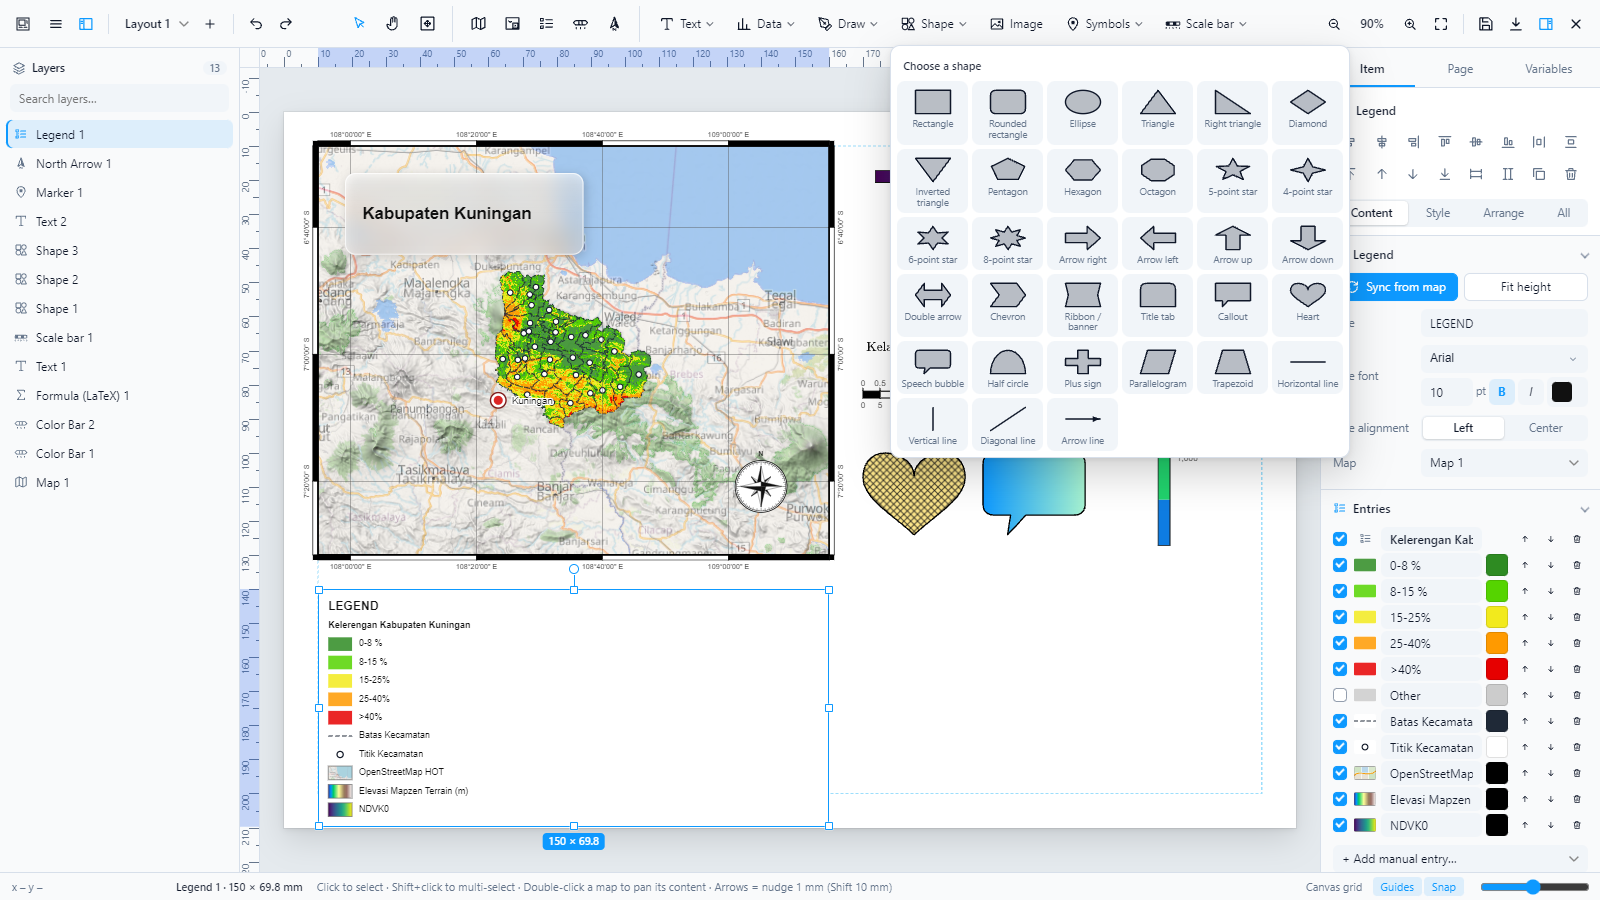 |
| 26 north arrows | Shape library |
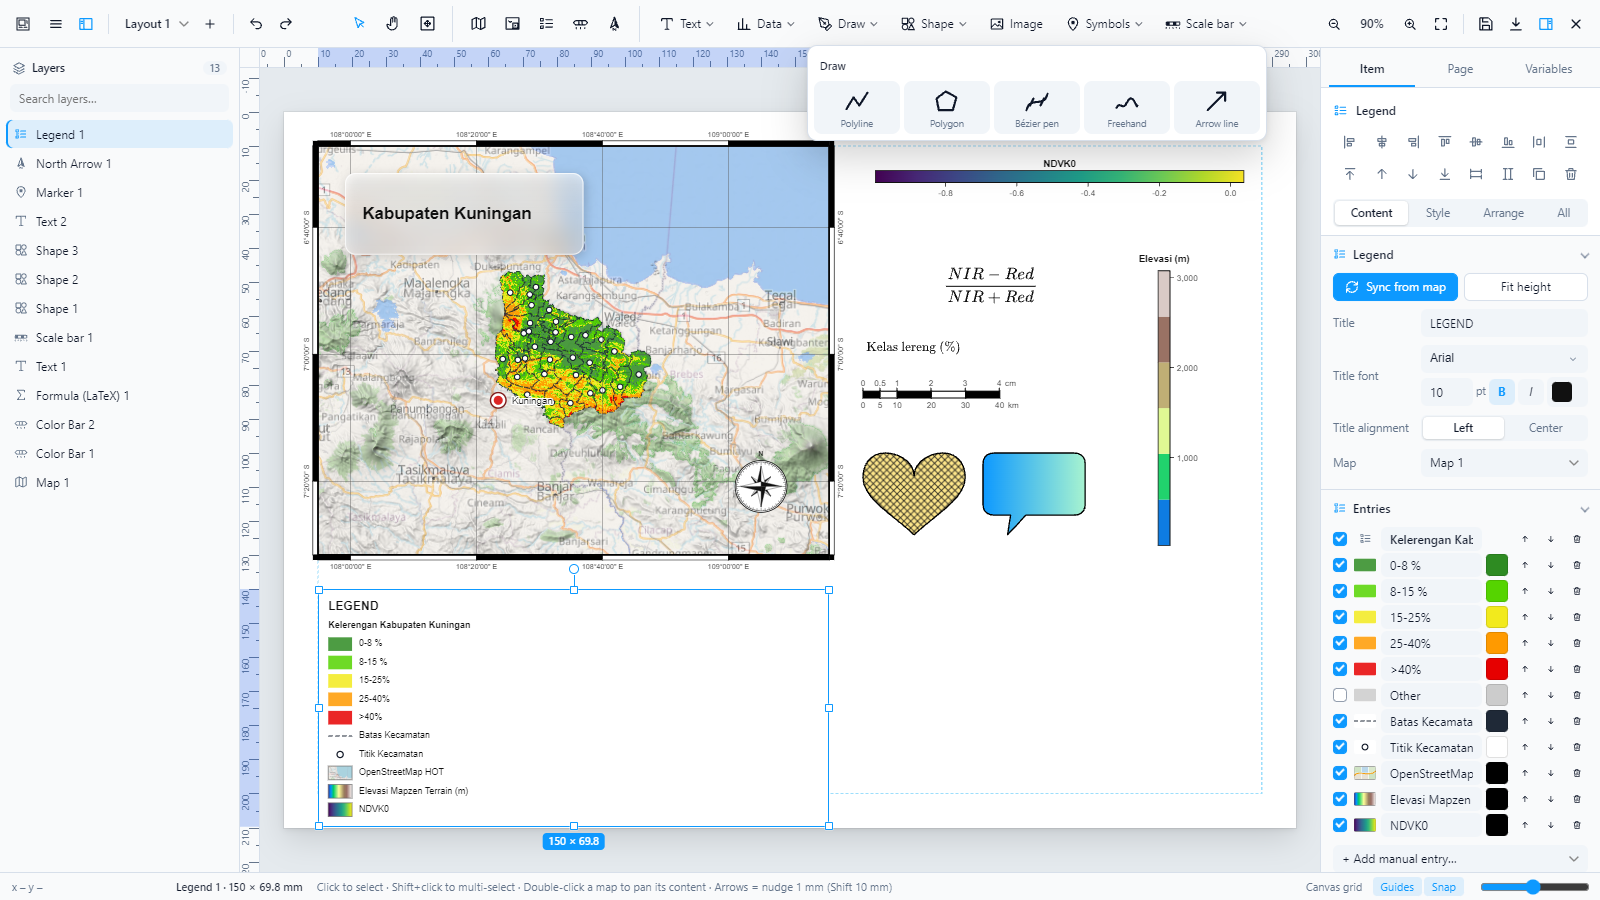 | 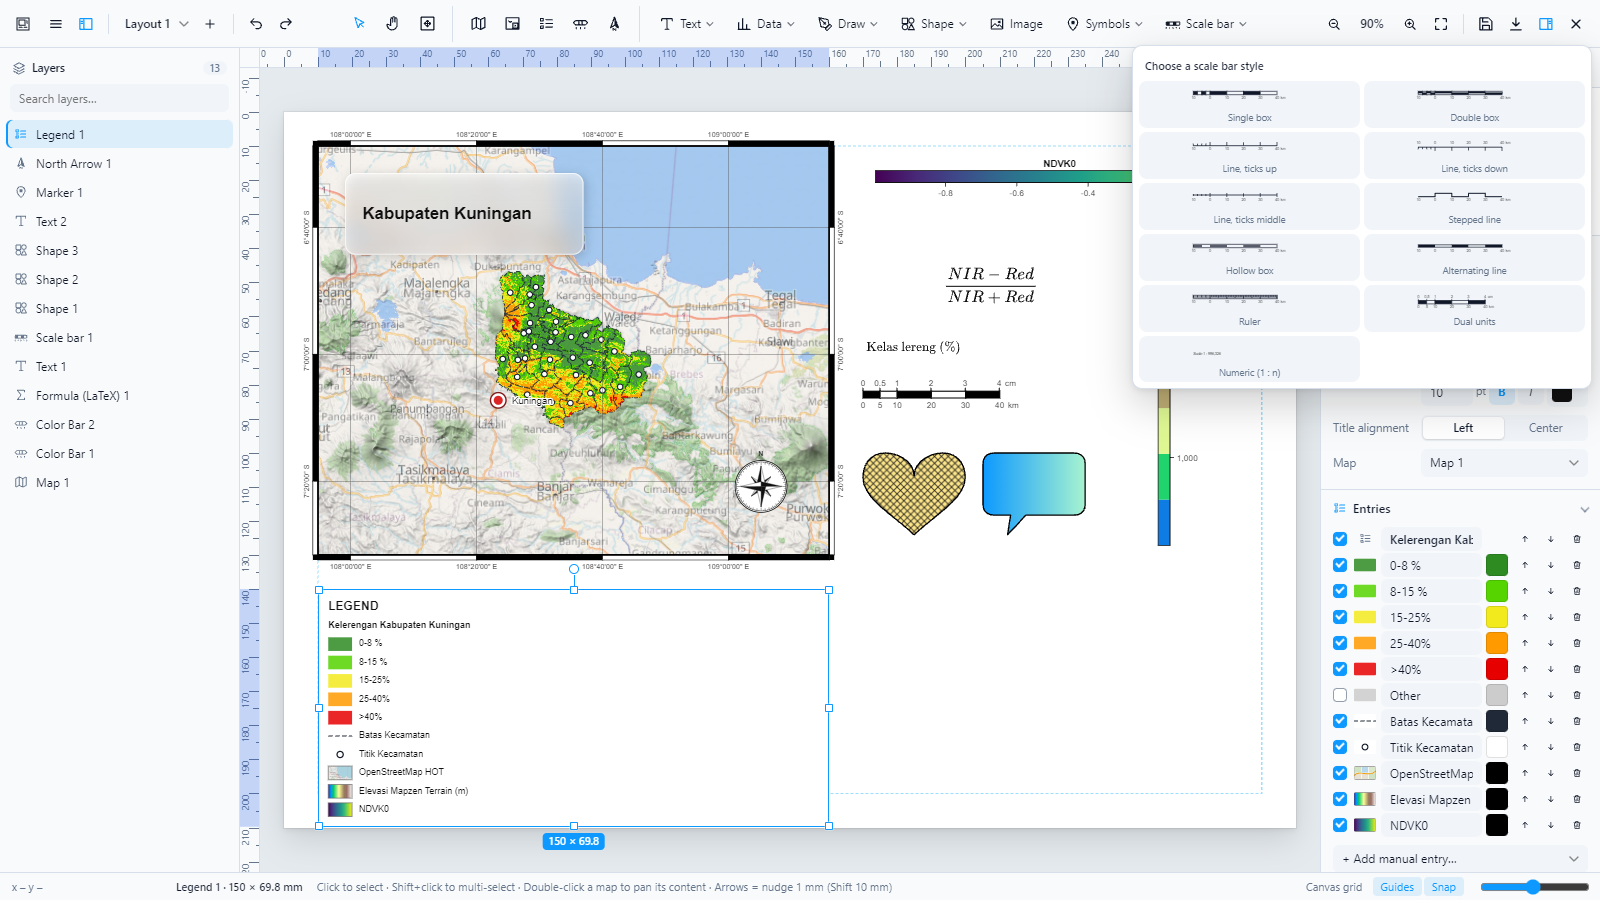 |
| Draw tools | Scale bar styles |
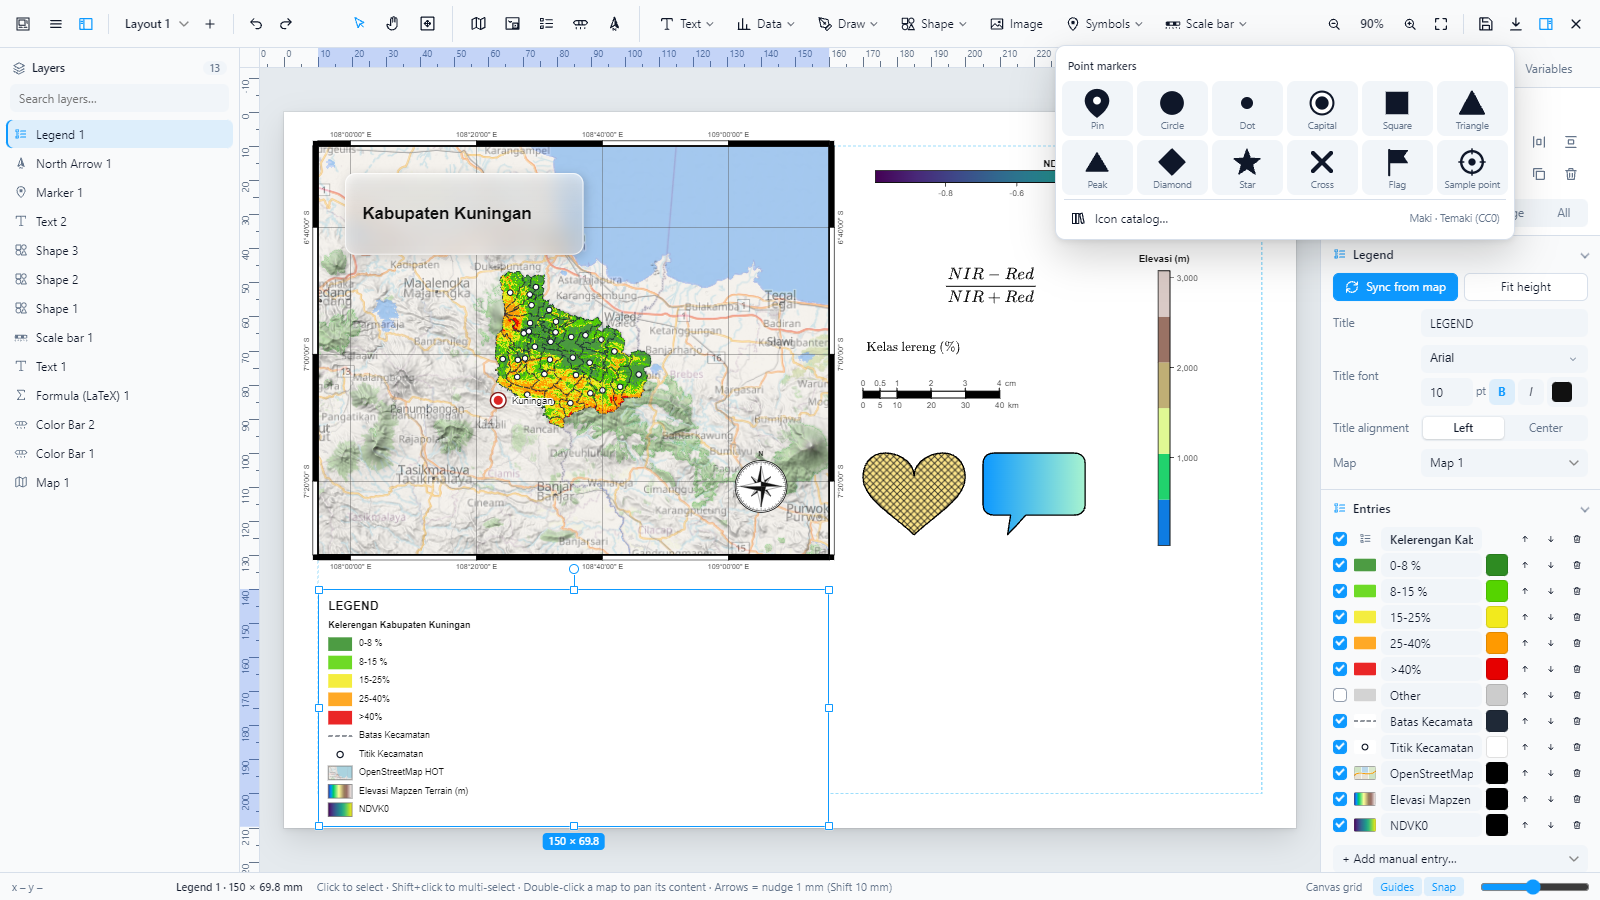 | 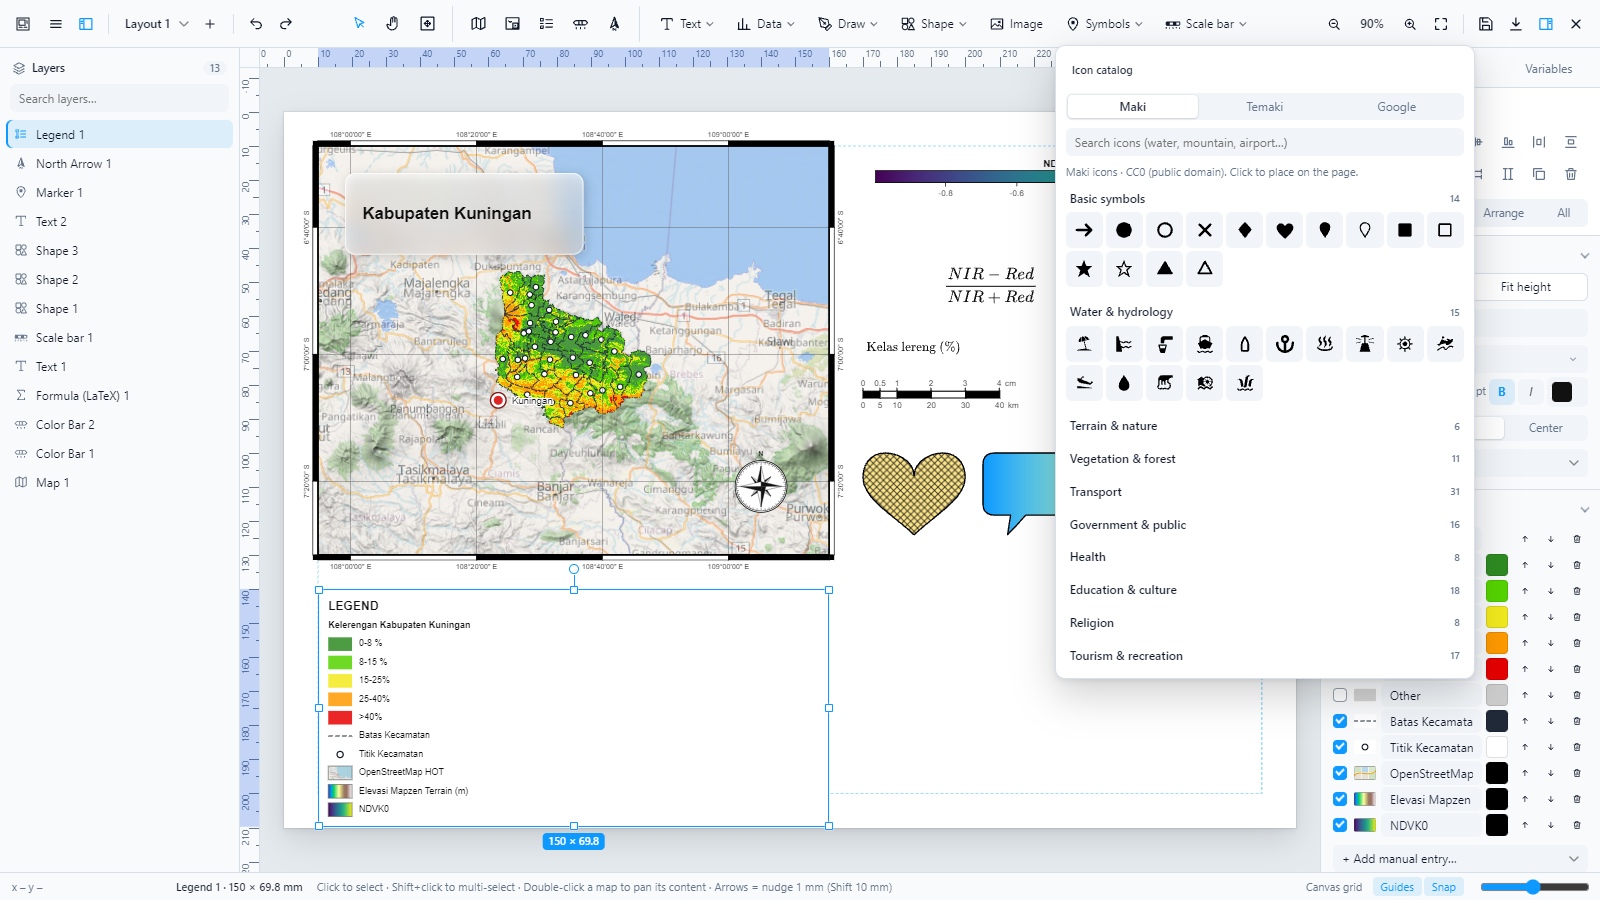 |
| Point markers | Maki / Temaki icon catalog |
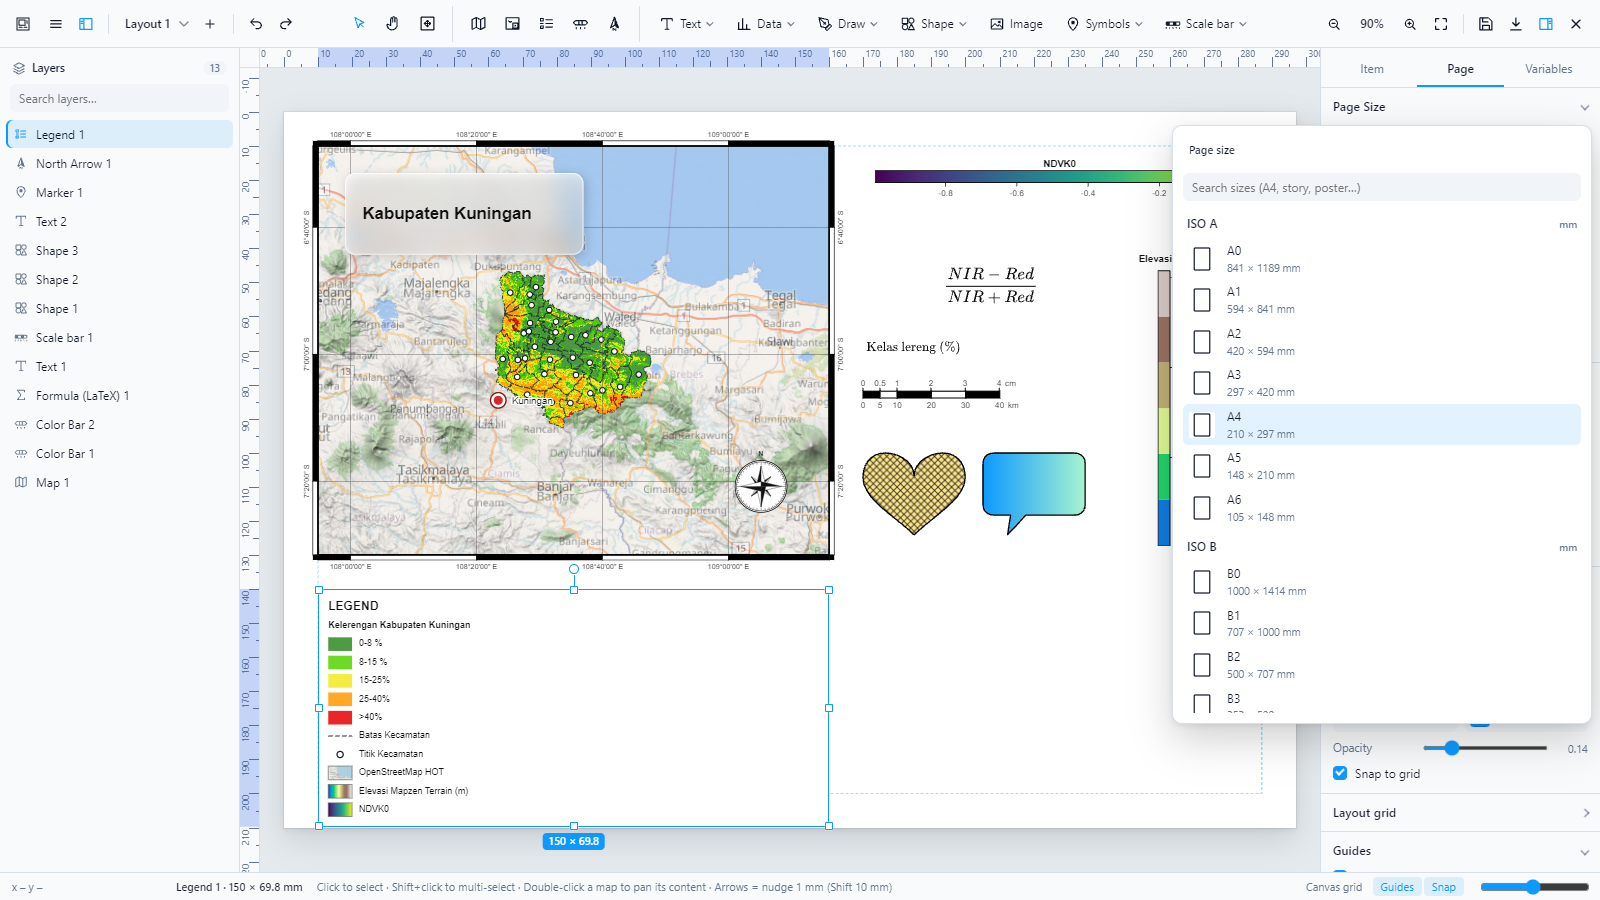 | 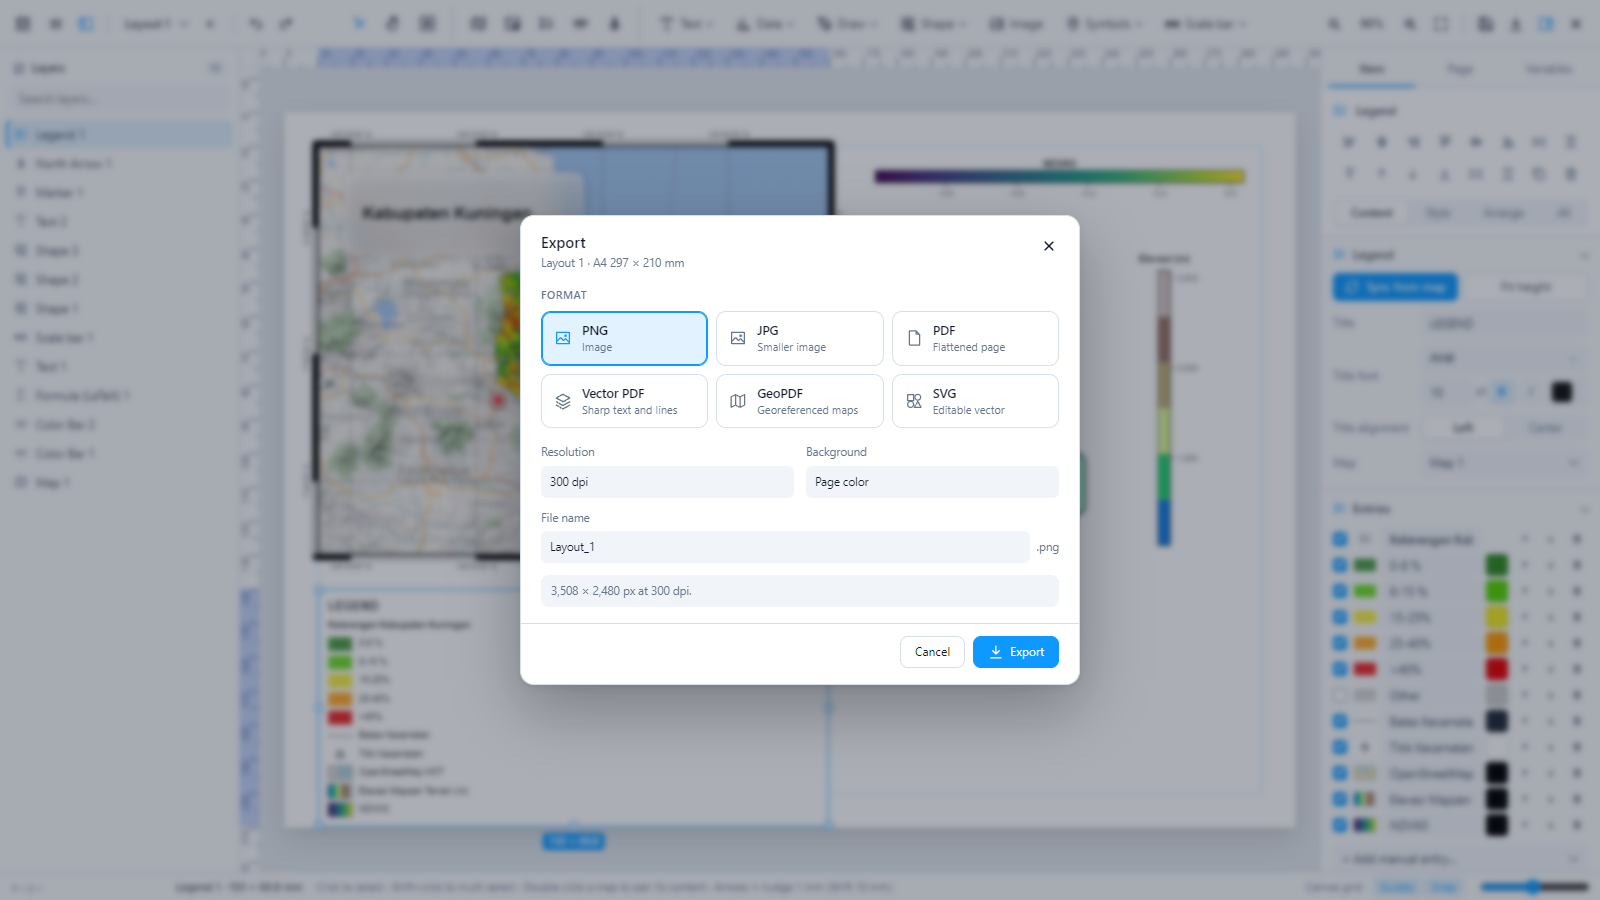 |
| Page size catalog | Export: PNG, JPG, PDF, vector PDF, GeoPDF, SVG |
 | |
| Layouts and user templates |
Install
Download
layout-composer-1.11.0.zipfrom Releases (or build it withpython tools/build.py --release).GeoLibre Desktop: copy the zip into
%APPDATA%\org.geolibre.desktop\plugins(Windows) and restart GeoLibre — or install it from Manage Plugins in Settings once it is in the registry.Enable Layout Composer in the Plugins menu. A Layout Composer menu with the plugin’s icon appears in GeoLibre’s menu bar: Open Layout Composer to design a print map, Back to the Map to return, plus Map Tools, the Map Tools ribbon and the tour.
Quick start
Set the page in the status bar (Portrait / Landscape) or in the Page tab of the property panel (size catalog).
On the Insert tab click Map, then drag a box on the page (or click once for the default size). The Map Frame and Grid tabs appear: set the scale, basemap, frame and the coordinate grid there. Use the Hand to move what is inside the frame.
Add Legend, Color bar, North, Scale bar, Text, LaTeX, Table, Symbol, HTML, Mermaid, Data (tables and charts), Draw, Shape, Image, Symbols from the Insert tab. The Format tab shows the settings of whatever is selected; All properties (Arrange group) opens the full side panel.
Click the Export icon at the top right. A window opens with the format (PNG, JPG, PDF, Vector PDF, GeoPDF, SVG), resolution, background and file name; a bar shows the progress from left to right. To continue in QGIS, use Export as QGIS template (.qpt) in the main menu.
Architecture
Every item is drawn as an SVG fragment in page millimetres. The same SVG is used on screen and in every export, so the preview matches the output. Map frames additionally host a live MapLibre instance laid out at the frame’s 96-dpi size and CSS-scaled to the canvas zoom, so labels and line widths keep their printed proportions.
Export pipeline
QGIS template exchange
Scale bars and legends are linked to their map through templateUuid, as QGIS expects in templates. Embedded SVG pictures are rewritten for QtSvg, the SVG engine QGIS uses (no nested <svg>, no dominant-baseline, one <text> per line).
Layout data model
Example map
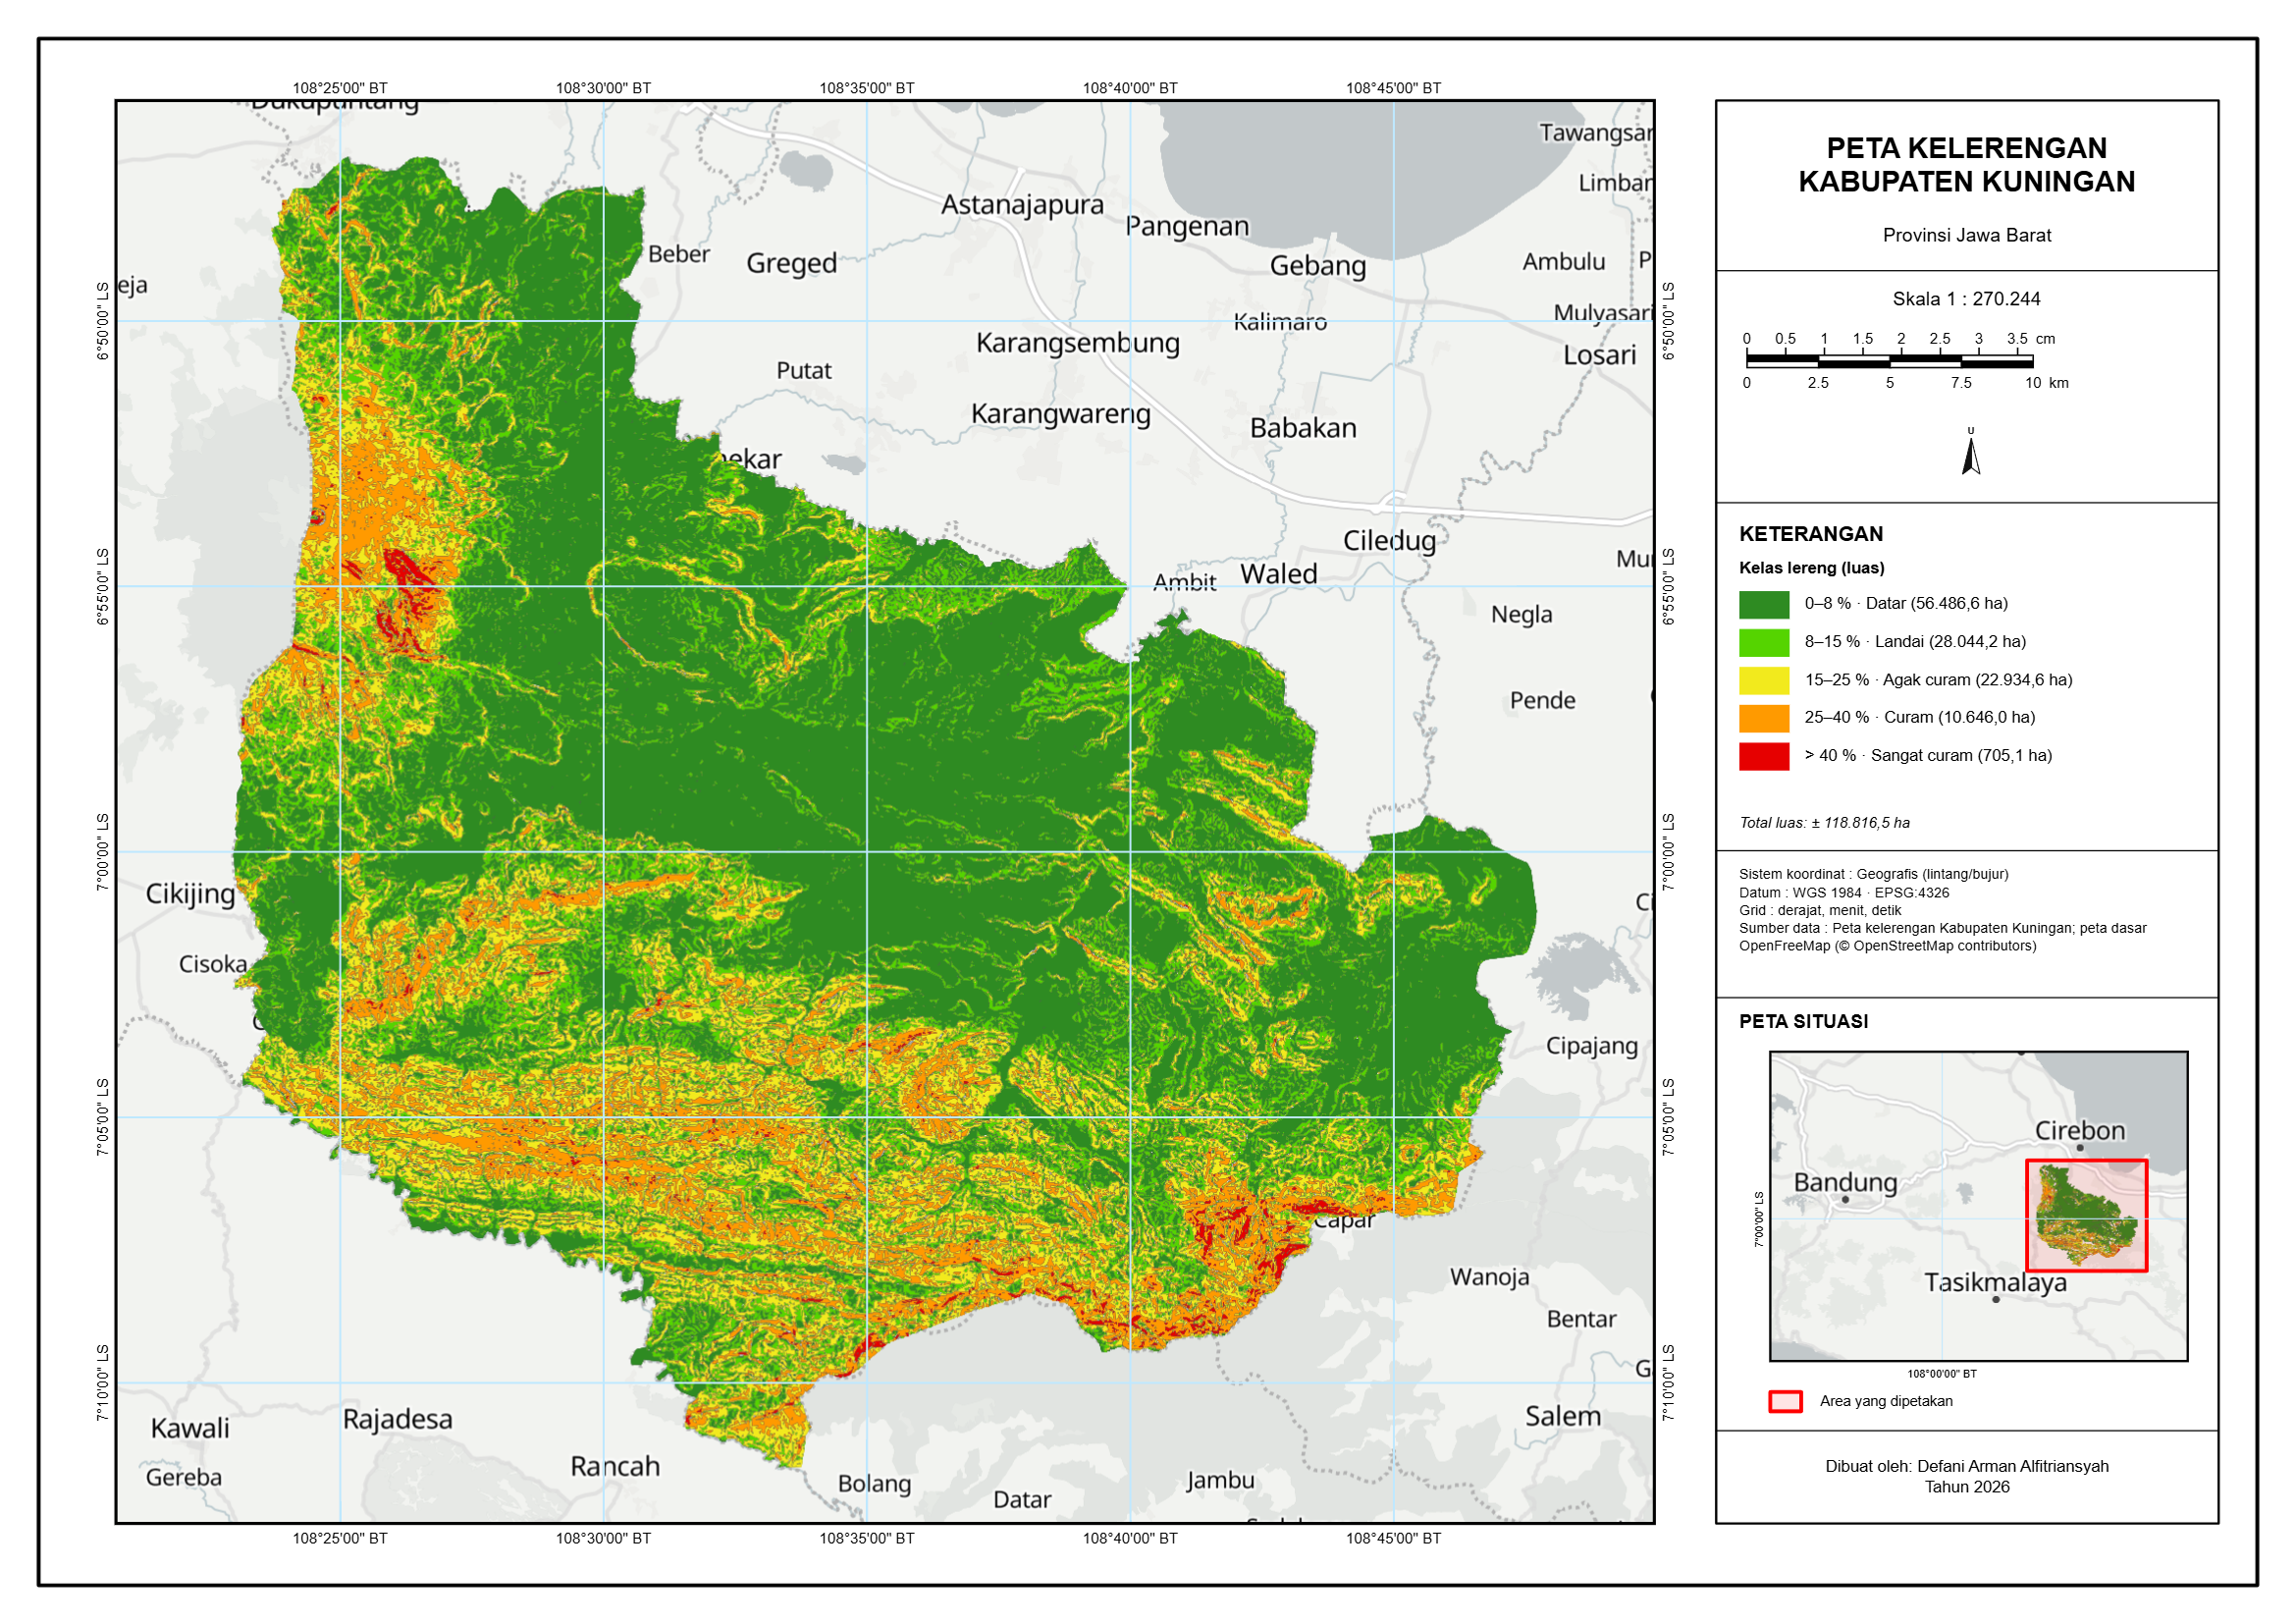
A slope map of Kabupaten Kuningan made with Layout Composer from real data (five slope classes with their area in hectares): map face with a DMS grid on the left, margin information on the right (title, numeric scale, dual-unit scale bar, north arrow, legend with areas, coordinate system and sources, key map, author). The layout file is in examples/.
Keyboard shortcuts
| Keys | Action |
|---|---|
V / H (or C) | Select / Hand: move map content, pan the page outside a map (or hold Space) |
| Shift + 1 / Shift + 2 | Fit page / zoom to selection |
Scroll (Shift + scroll: sideways), Ctrl + + / − / 0 / 1, numpad + / − | Zoom canvas / fit page / 100 % |
| Middle mouse drag · right click | Pan the page · select and open the context menu |
| While drawing an item: Shift · Alt · Esc | Keep proportions · draw from the centre · cancel |
| Arrows (Shift ×10, Alt ×0.1) | Nudge 1 mm |
| Ctrl + Z / Y | Undo / redo |
| Ctrl + C / V / D | Copy / paste / duplicate |
| Ctrl + G, Ctrl + Shift + G | Group / ungroup |
| Delete | Delete |
| Double-click map | Pan/zoom map content (Esc to finish) |
| Pen: Enter, double-click, Backspace, Esc | Finish, finish, remove point, cancel |
| Alt while dragging · Shift while dragging | No snapping · lock direction / proportions / 15° rotation |
Development
src/            sources (JavaScript and style.css), bundled and minified into plugin/
  01-core.js        state, history, storage, variables
  02-symbols.js     north arrows, shapes, scale bar styles
  03-geo.js         Web Mercator, UTM, grids
  04-items.js       item types and SVG renderers
  04b-colorbar.js   matplotlib-style color bar + colormaps
  04c-latex.js      MathJax formulas, symbol catalog
  04d…04h           fills/paths, dual scale bar, effects/markers, icon catalog data/UI (04g2: Material Symbols)
  04i-data.js       attribute tables and charts (aggregation, ellipsoidal area and length)
  04k-plotly.js     Plotly charts (21 kinds, styles, cached SVG)
  05-maps.js        MapLibre frames, legend from styles, capture
  06-ui.js, 06b, 06c   editor shell, interactions, draw tools, templates
  06d, 06e          Canva-style adding and inline editing; Google Fonts and the font picker
  07-props.js, 07b, 07c  property panels, color wheel + ribbon (Insert / Format tabs), page sizes
  07b2…07b8         ribbon groups: text (Word), tables, symbols dialog, map frame / grid, HTML + Mermaid, pictures + remove.bg, charts
  07d-dataprops.js  panels for tables, charts and layers per map frame
  08-export.js      PNG/JPG/PDF/vector PDF/GeoPDF/SVG
  08b-qpt.js        QGIS .qpt template import and export
  08c-mapseries.js  Map Series (atlas): pages per feature, variables, multi-page export
  09-plugin.js      GeoLibre plugin entry
  10b-palette.js    Category Colors: Distinct 200 / KLHK / ColorBrewer palettes applied to a layer
  10-maptools.js    Map Tools ribbon and menu: MGRS/UTM/DMS coordinates, features from coordinates and tables, map chips
plugin/         plugin.json, LICENSE, NOTICE.md; index.js and style.css are built
vendor/         jsPDF, svg2pdf.js, MathJax, Mermaid and Plotly.js as released, embedded in the bundle
tools/          build.py (bundle, minify, zip), build_catalog.py (groups Maki/Temaki icons by type), build_material.py (Material Symbols by category), screenshots.py (README images)
test/           HTML test harnesses (MapLibre + mock GeoLibre API)
examples/       sample layouts
sh build.shBuilds a single minified ES module (plugin/index.js, esbuild) and plugin/style.css, then zips them as layout-composer.zip; --release also writes dist/layout-composer-<version>.zip with its SHA-256. Put the esbuild binary on PATH, in tools/bin/, or set ESBUILD. The plugin loads no code from other hosts: jsPDF, svg2pdf.js, MathJax, Mermaid and Plotly.js are embedded and started from a Blob URL the first time they are needed. To test without GeoLibre, serve the folder (python -m http.server) and open test/index.html.
Licenses and third-party notices
This plugin: MIT License © 2026 Defani Arman Alfitriansyah — see LICENSE.
| Component | Used for | Source | License |
|---|---|---|---|
| MapLibre GL JS | Map rendering (provided by the GeoLibre host, not bundled) | maplibre.org | BSD-3-Clause |
| MathJax 3.2.2 | Renders LaTeX as SVG (bundled, started on first use) | mathjax.org | Apache-2.0 |
| jsPDF 2.5.1 | PDF / GeoPDF output (bundled, started on export) | github | MIT |
| svg2pdf.js 2.2.4 | Vector PDF (bundled, started on export) | github | MIT |
| Plotly.js 2.35.2 (plotly.js-dist-min) | Charts (bundled, started on first chart) | github | MIT |
| Mermaid 11.4.1 | Diagrams (bundled, started on first diagram) | github | MIT |
| remove.bg API | Remove background on pictures (online, only when clicked, with your own API key) | remove.bg/api | remove.bg terms of service |
| Maki 8.2.0 icons | Icon catalog | github | CC0-1.0 |
| Temaki 5.13.0 icons | Icon catalog | github | CC0-1.0 |
| Material Symbols (material-symbols/svg-400 0.47.4) | Icon catalog, Google tab (loaded from jsDelivr on use) | fonts | Apache-2.0 |
| Google Fonts | Fonts (loaded from fonts | fonts.google.com; family list from the Fontsource API | Each family’s own open license (SIL OFL 1.1, Apache-2.0 or UFL) |
| UI icons, north arrows, shapes, scale bars, markers | Editor and layout items | Original inline SVG drawn for this project | MIT (this project) |
| GeoPDF writer | ISO 32000 /VP /Measure /GEO | Ported from GIS Consultant Studio (same author) | MIT |
| Viridis, Plasma, Inferno, Magma, Cividis | Colormaps | Matplotlib (van der Walt & Smith; Nuñez et al.) | CC0 |
| Turbo | Colormap | Google AI (Anton Mikhailov) | Apache-2.0 |
| Spectral, RdYlGn, RdYlBu, RdBu, BrBG, YlGn, YlOrRd, Blues, Greens, Oranges, Reds, Purples, Greys | Colormaps | ColorBrewer — Cynthia Brewer | Apache-2.0 |
| Coolwarm, Jet, Terrain, Gray | Colormaps | Matplotlib (Coolwarm: K. Moreland) | Matplotlib license (BSD-style) |
| Basemap styles in map frames | Optional per-frame basemaps | OpenFreeMap styles; data © OpenStreetMap contributors | Styles BSD-3-Clause / data ODbL-1.0 |
| Satellite / topographic raster basemaps | Optional per-frame basemaps | Esri World Imagery / World Topo Map tile services | Esri terms of use — attribute the provider when publishing |
| Installed fonts | Text | System fonts and fonts installed on your computer (none bundled) | Their own licenses |
Map content you add (GeoLibre layers, logos, data) keeps its own license; credit your data sources in the layout.