A static web chart builder for publication-ready figures. and export a print-quality PNG or SVG. It’s a static web app — everything runs entirely in your browser, hosted for free on GitHub Pages, with no server, no database, and no account required.
Repositori di GitHub · Halaman web
A single-page, no-backend chart builder for publication-ready figures — paste your data, style it, lay it out, and export print-quality PNG/SVG. 100% client-side, hosted free on GitHub Pages.

















🔗 apps: defani
Table of Contents
What is this?
Ploots Click is a client-side-only web app: open the page (or visit the GitHub Pages link below) and everything — data parsing, chart rendering, maps, page layout, and export — happens locally in your browser tab (maps fetch their basemap tiles online). Nothing you paste or upload is ever sent to a server, because there is no server. The app is just static HTML, CSS, and JavaScript, deployed straight from this repository via GitHub Pages, which is why it costs nothing to run and needs zero setup.
Desktop app
Ploots Click also runs as a desktop app for Windows, built with Tauri 2 like GeoLibre Desktop. It uses the system’s WebView2, so the installer is small.
Nothing is hosted. The app’s code, libraries (Fabric.js, MapLibre GL, AG Grid, MathJax, SheetJS, jsPDF, Plotly, geotiff.js, …), fonts and icons are all inside the app. It makes no calls to CDNs, Google Fonts or the Iconify API. Files you open stay on your computer.
Online only when you ask. Basemap tiles, the data catalog (government ArcGIS servers, GFW, GBIF, iNaturalist), KoboToolbox and the Claude bridge (
ws://127.0.0.1:9878, on your own computer) connect only when you use them.KoboToolbox without a proxy. The app reads the Kobo API natively, so
tools/kobo_proxy.pyis not needed. The access setting shows “Built-in”.Web links open in your default browser.
Install: download Ploots Click_<version>_x64-setup.exe (or the .msi) from the repository’s Releases page, or from the “ploots-click-windows” artifact of the Desktop app workflow run. The setup installs for the current user only and does not need administrator rights. If WebView2 is missing, the installer gets it.
Build it yourself (Windows):
Install Rust, the Visual Studio Build Tools with the “Desktop development with C++” workload, Python 3, and the Tauri CLI (
cargo install tauri-cli --version "^2" --locked, ornpm install -g @tauri-apps/cli@^2with Node.js).Build the offline copy of the web app into
desktop/dist. Downloads are cached indesktop/.cache:python desktop/build_dist.pyBuild the installers from the
desktopfolder withcargo tauri build(ortauri buildwith the npm CLI). They land indesktop/src-tauri/target/release/bundle/nsis/and…/msi/.
The GitHub workflow .github/workflows/desktop.yml runs the same steps on every push that changes the app. Pushing a desktop-v* tag publishes a release.
Interface
The app opens on a Home screen: make a Chart from tabular data or a Map from spatial data, blank or from a sample.
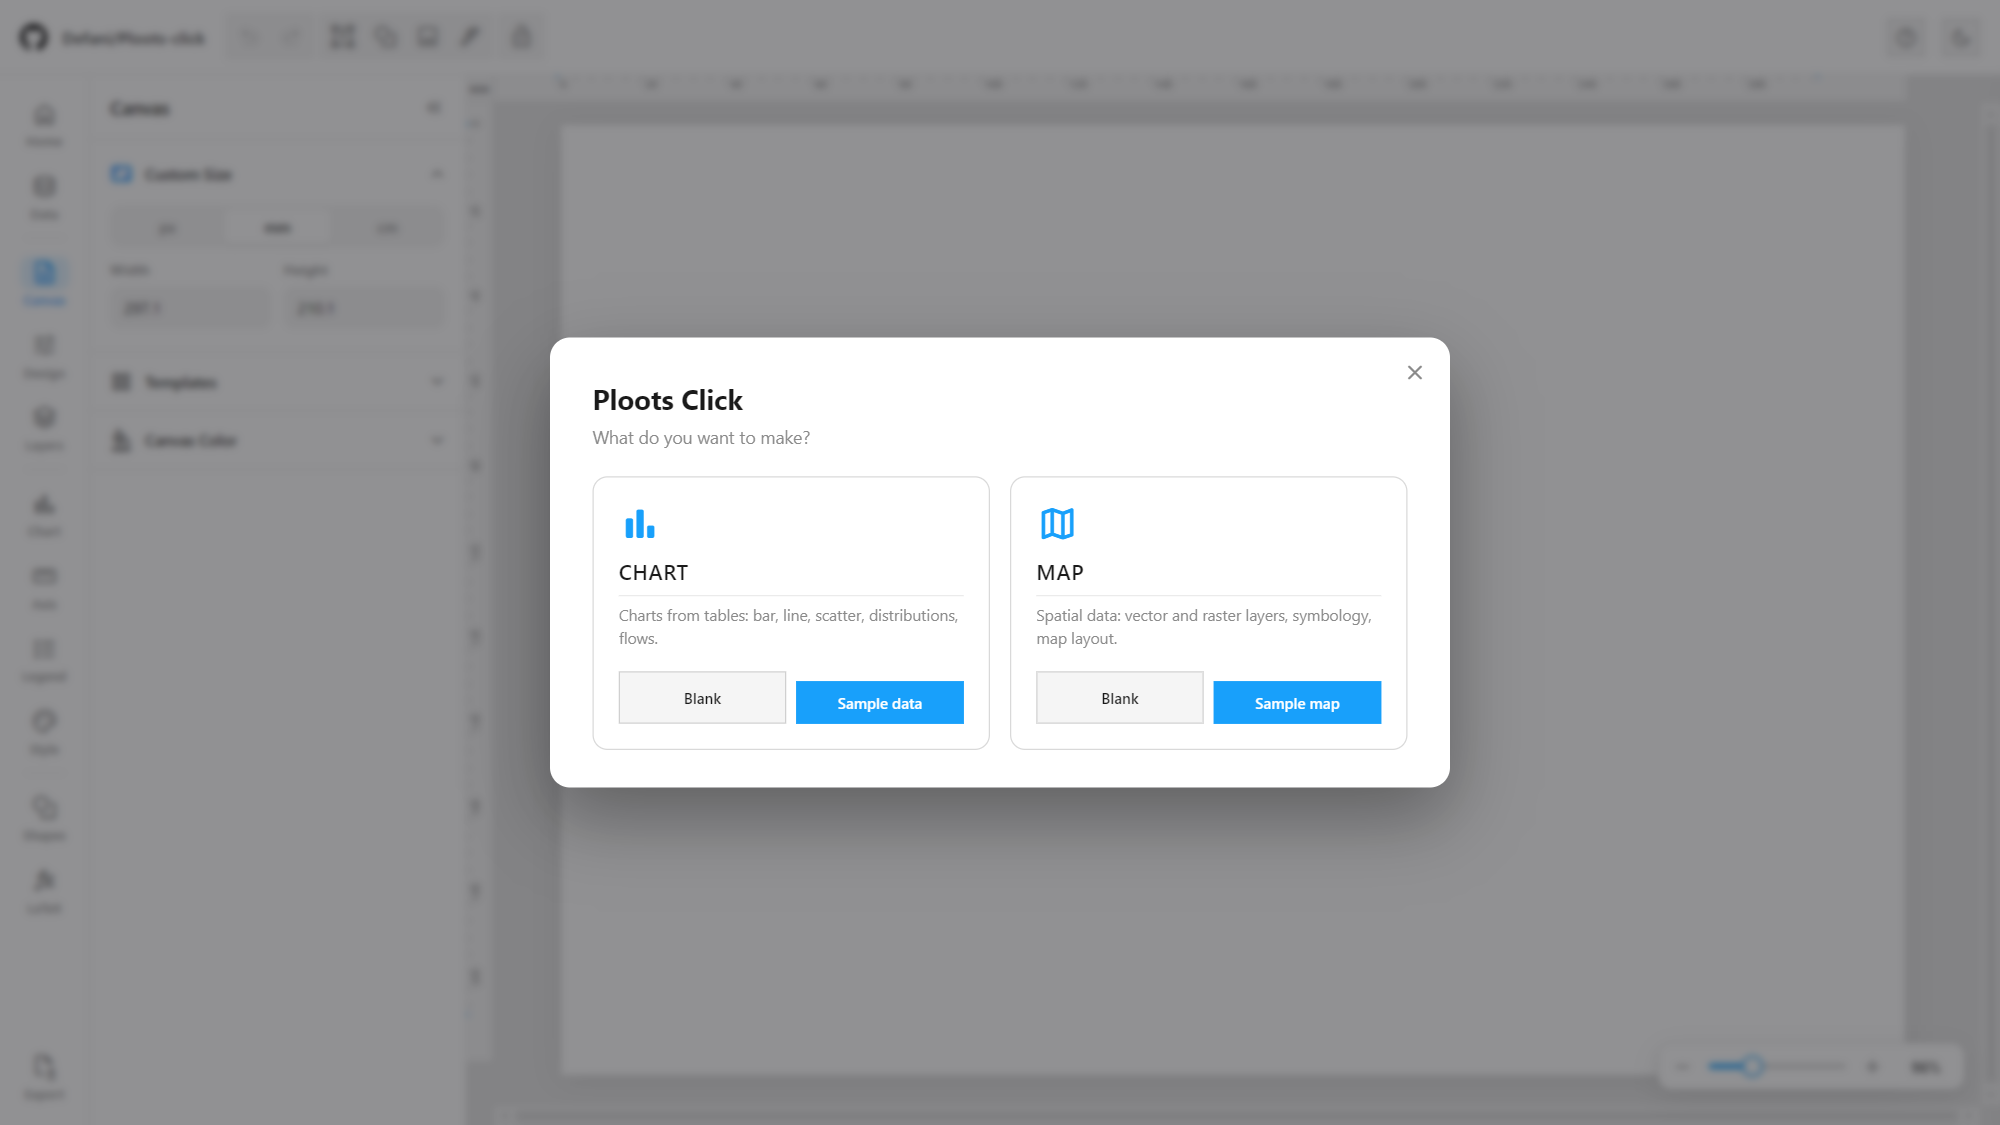
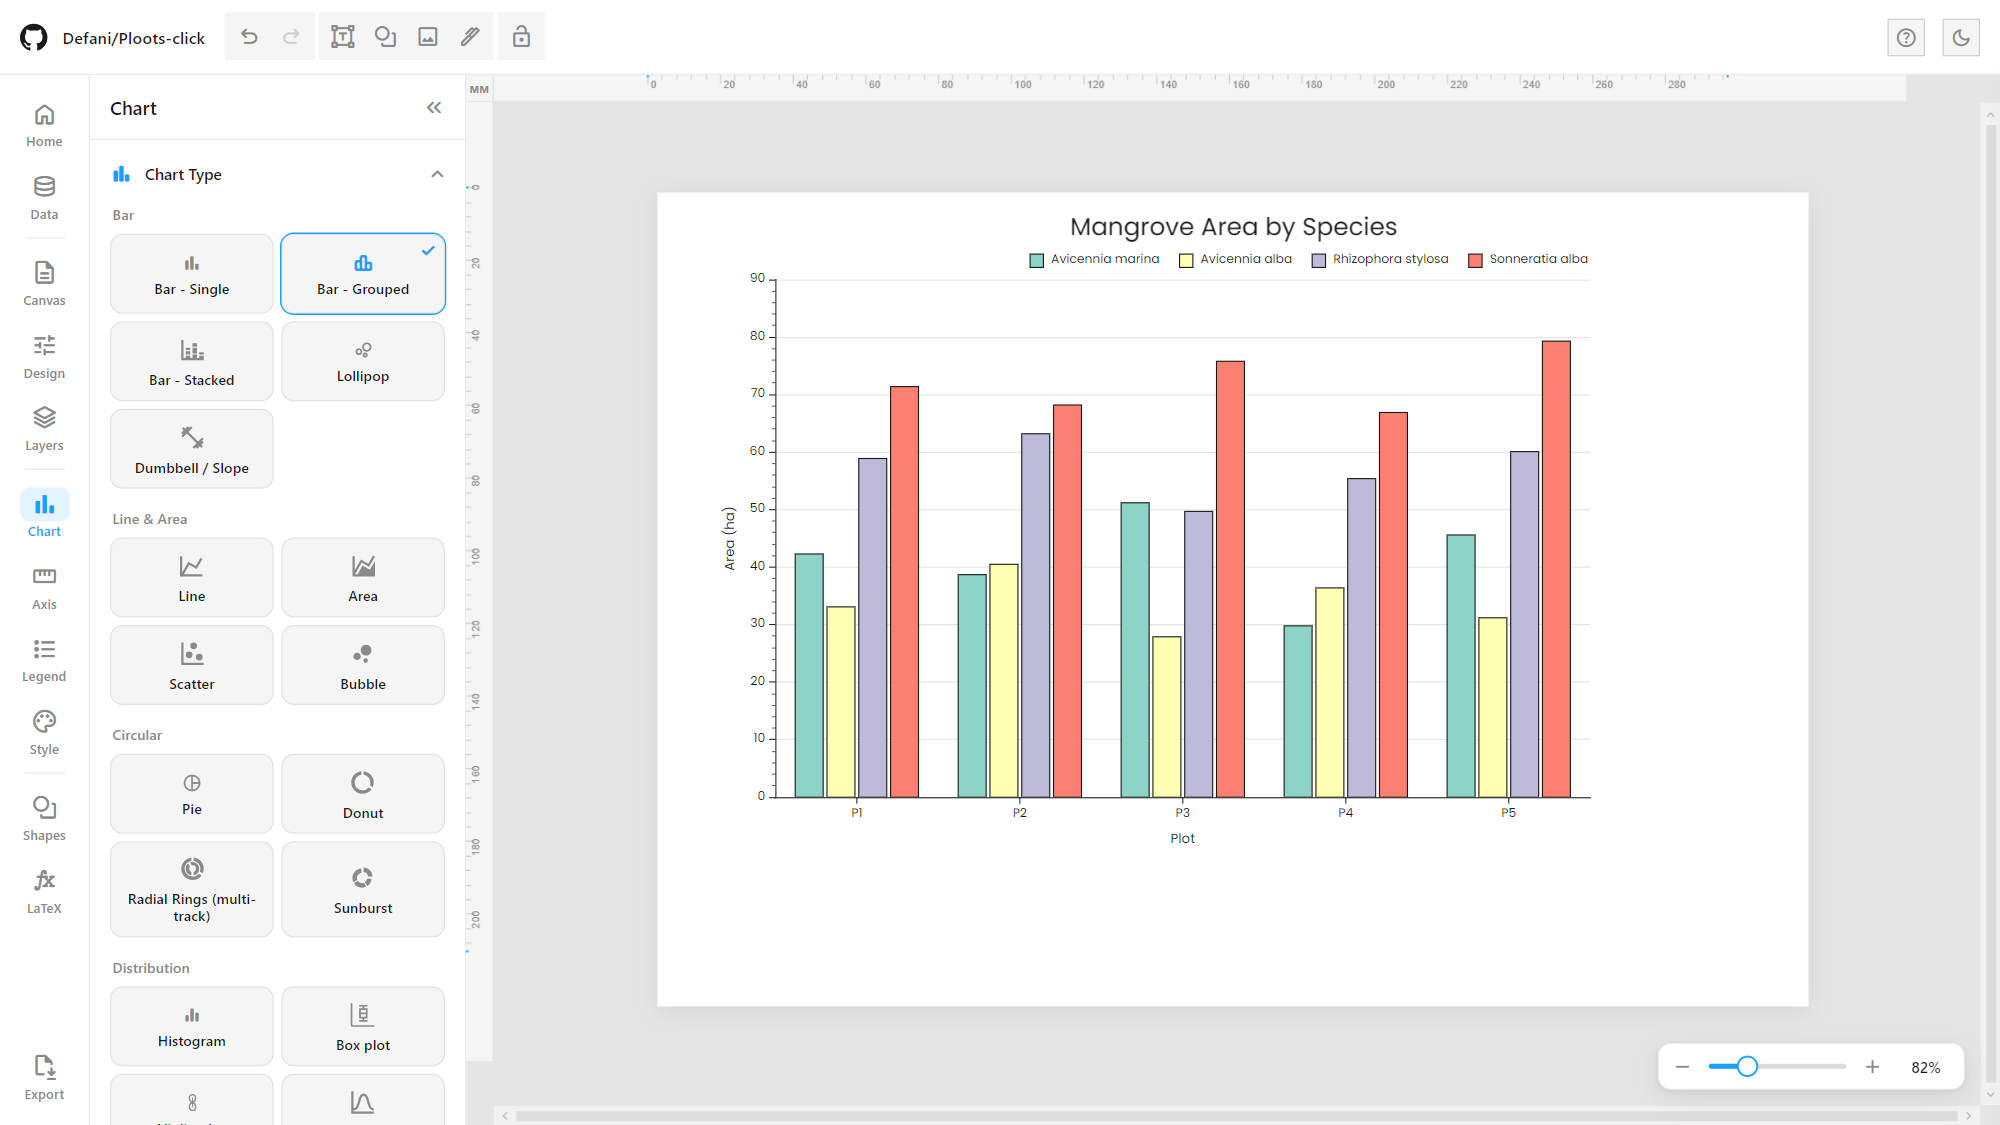
Everything is set from one sidebar on the left, so the page keeps the rest of the window. Its rail is grouped by task — Home · Data (charts) or Map (maps) · Canvas, Design, Layers · Chart, Axis, Legend, Style (charts) · Shapes, LaTeX · Export — and each mode only shows the menus it uses. The page canvas has rulers, the mouse wheel zooms, and a dark theme is one click away (moon icon):
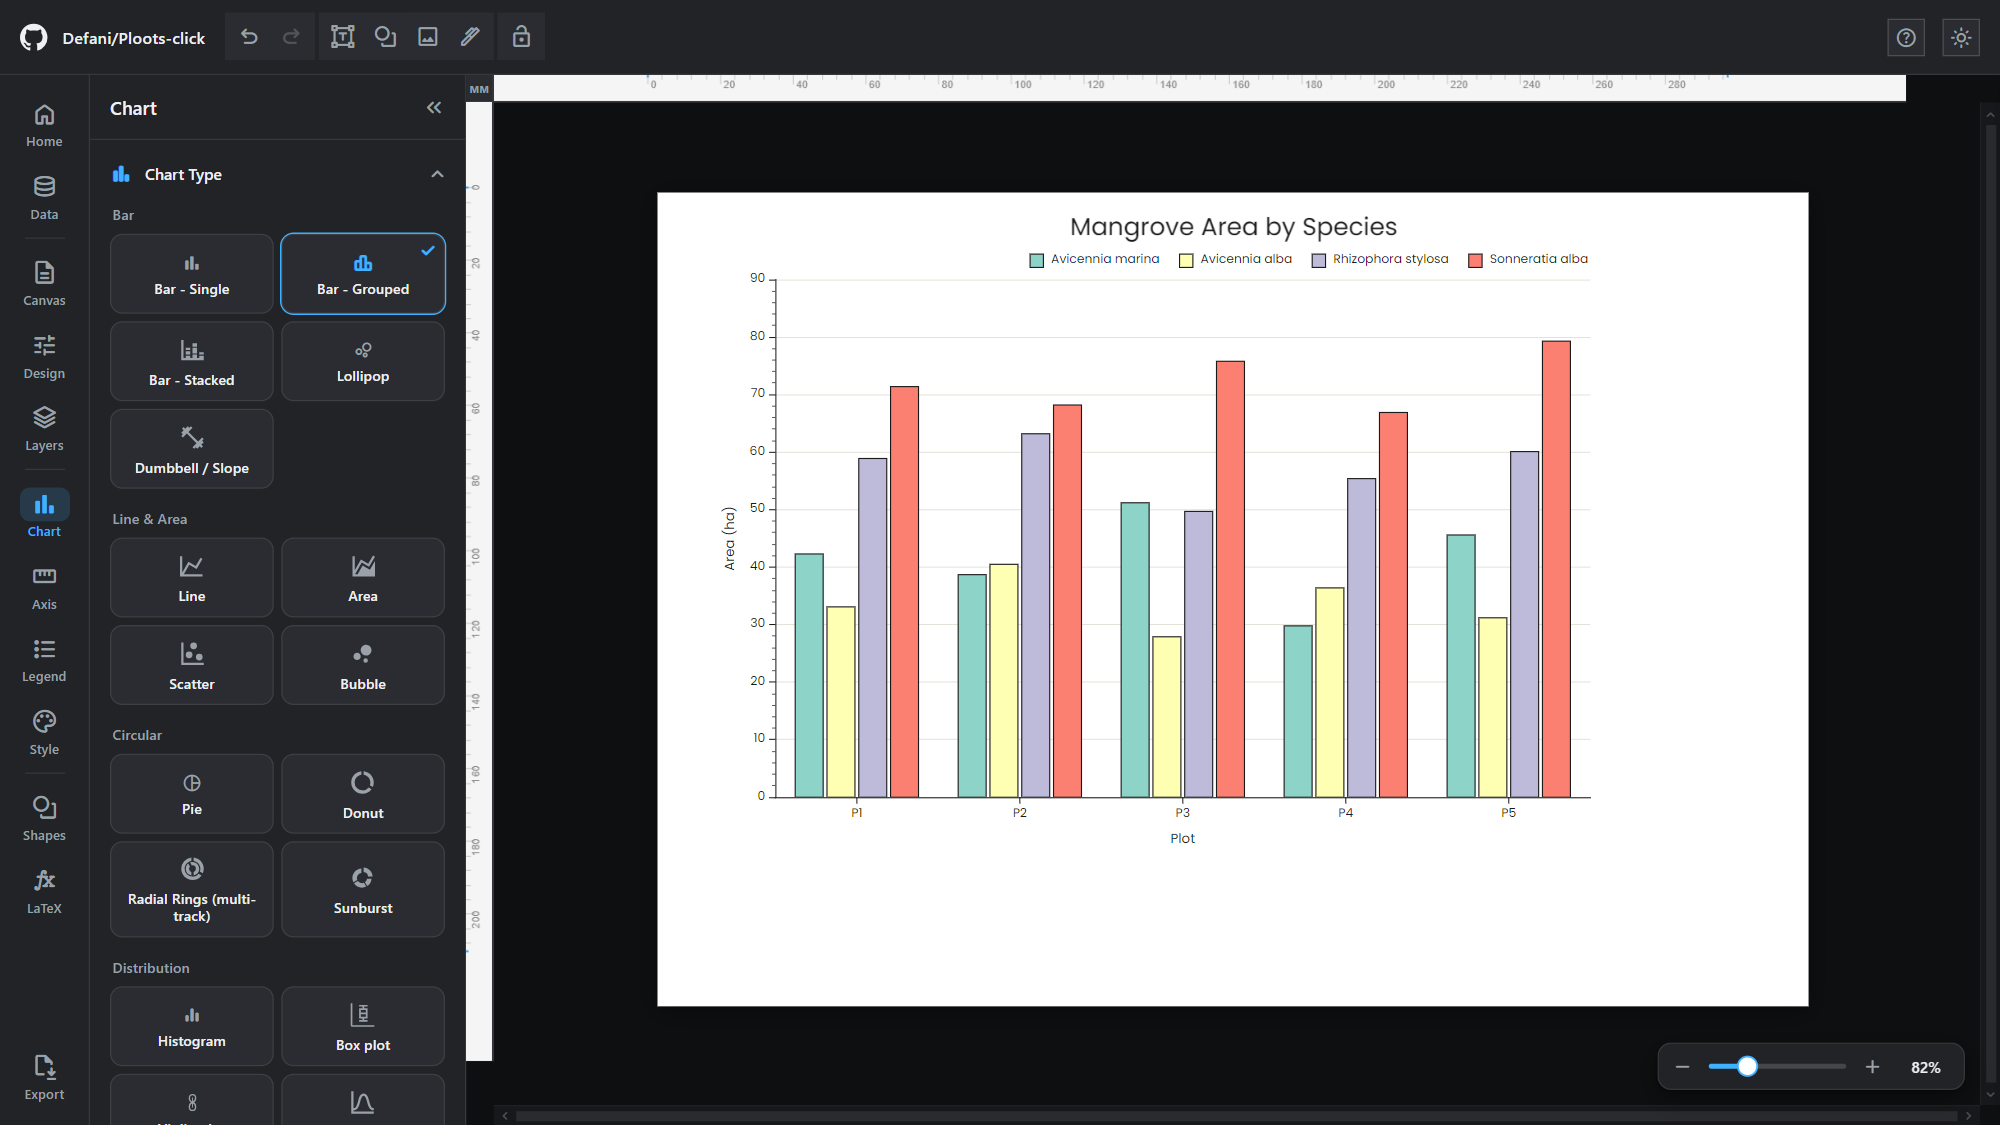
Live app: defani
Features
Charts
25 chart types, all drawn by one D3.js engine (
js/d3-engine/), so axes, ticks, legends, titles, patterns and export behave the same on every chart:Group Chart types Bar single bar, grouped bar, stacked bar (incl. 100%), lollipop, dumbbell / slope Line & Area line, area, scatter, bubble Circular pie, donut, radial rings (multi-track), sunburst Distribution histogram, box plot, violin plot, ridge plot Other heatmap, waterfall, funnel, treemap, sankey, scatter matrix Map choropleth map, bubble map Maps (choropleth and bubble map) are drawn with d3-geo from Natural Earth base maps served locally from
vendor/topojson/, so they work offline. Choropleth takes ISO-3 codes or country names, a continuous or classed colour scale, several scopes (world, continents, USA) and projections, a fixed value range for comparing maps, or your own custom GeoJSON (e.g. Indonesian provinces).Radial rings (multi-track): circular category plot in the style of multi-genome COG/functional-category figures. Categories become angular sectors (width ∝ average share), each series a concentric track, with outside labels that are spread apart and joined to their sector by leader lines.
Sunburst: slash-delimited paths (
Vegetasi/Mangrove/Rapat) become a hierarchy; click a segment to zoom in, click the centre to zoom back out.Sankey: rows written as
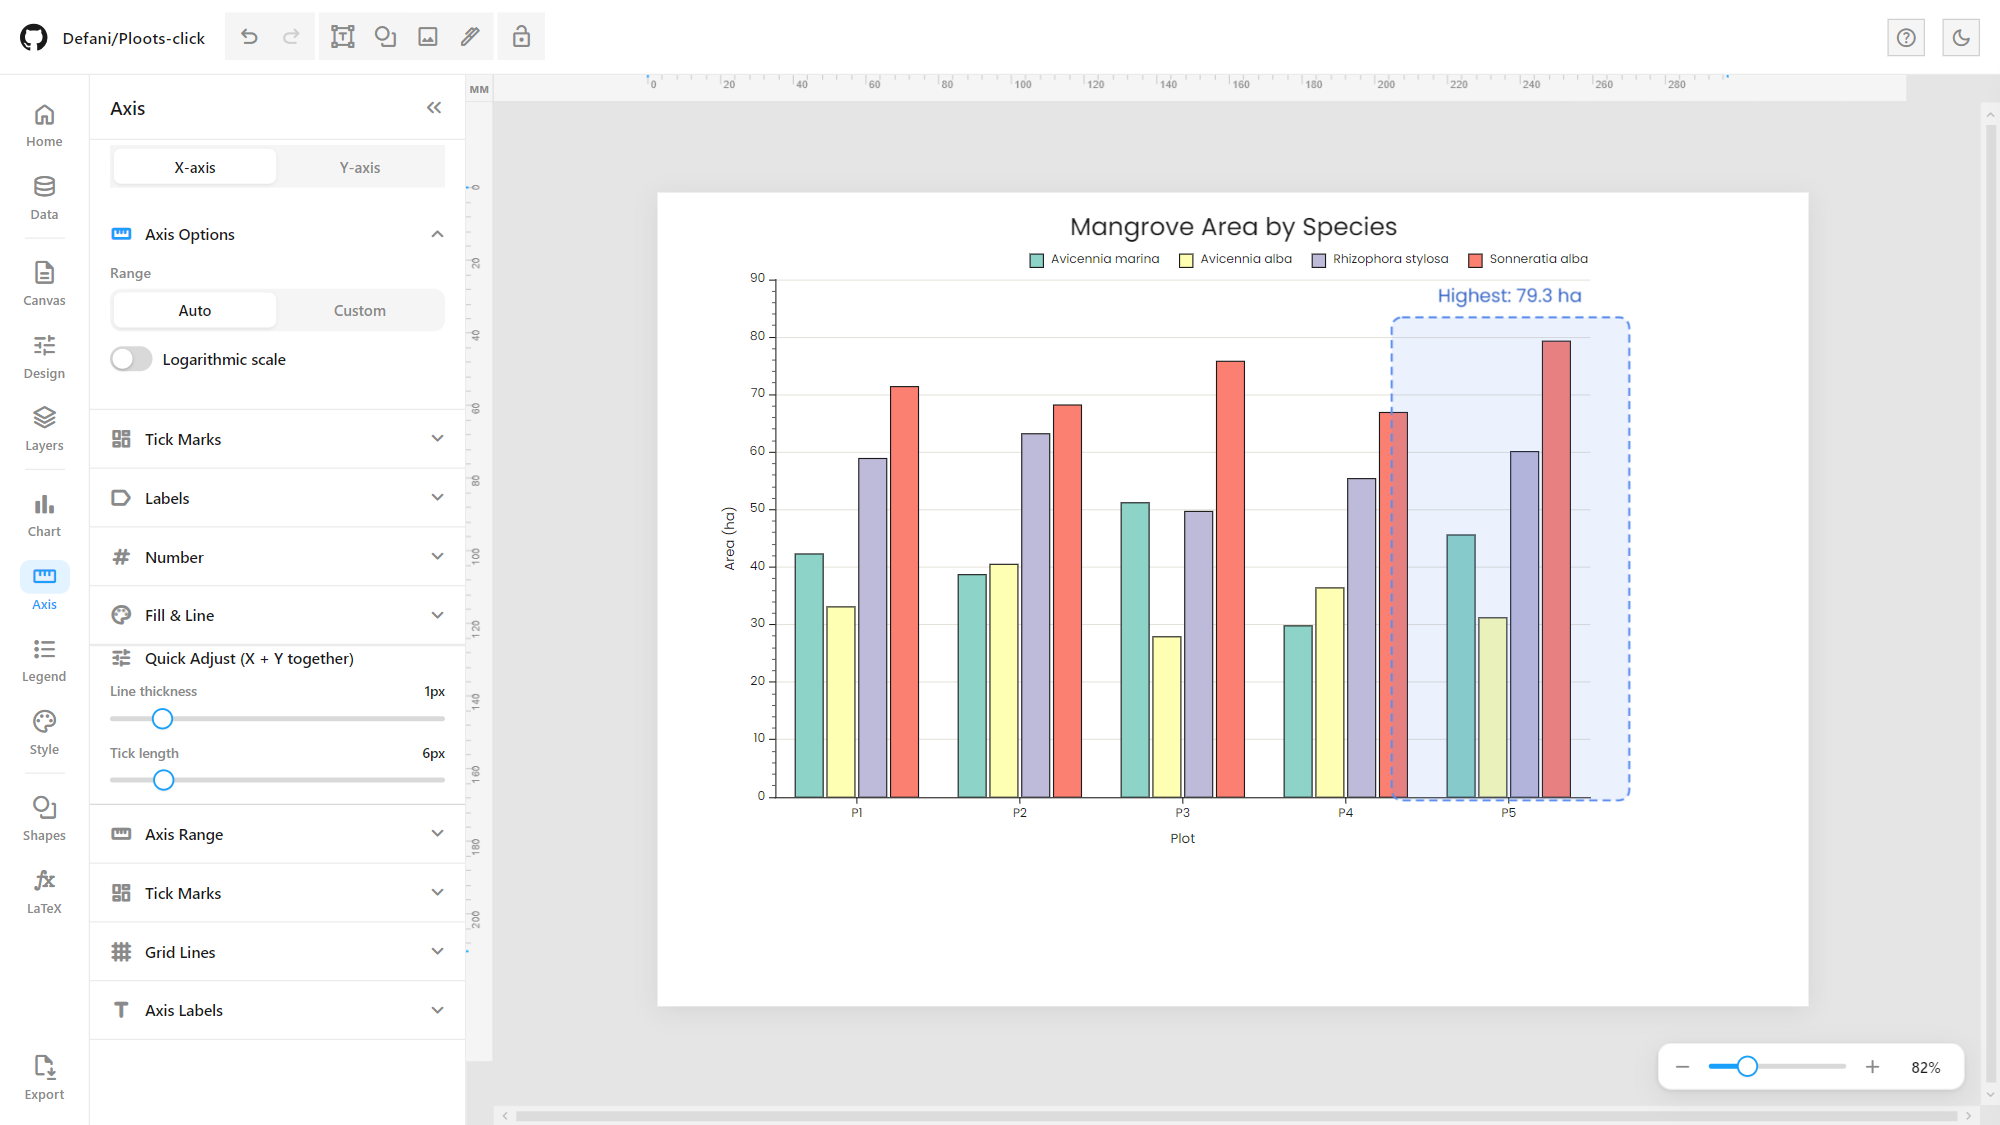
Source -> Targetbecome flows between nodes, with links drawn as filled ribbons.Format Axis: click an axis on the chart to open a per-axis panel: range (auto or fixed), logarithmic scale, major/minor tick spacing, tick marks and their position, number format, line width and colour.
Data input: paste tab- or comma-separated data, or import CSV/TSV/TXT (Papa Parse, so quoted fields and embedded commas are handled), Excel
.xlsx/.xls(SheetJS, multi-sheet), or JSON (array of objects or 2D array).Per-series controls: visibility, colour, label, fill pattern, marker shape, and a secondary Y-axis (bar/line/area/scatter).
Visual style modes: Color, Color + Pattern, or Pattern (grayscale), backed by 8 hatch/fill patterns, so figures stay readable in print or black-and-white.
106 built-in colour palettes, see Color Palettes.
Typography: 5 fonts (Cambria, Times New Roman, Arial, Poppins, Cambria Math) with separate controls for the title/subtitle and for the chart body, axes and legend.
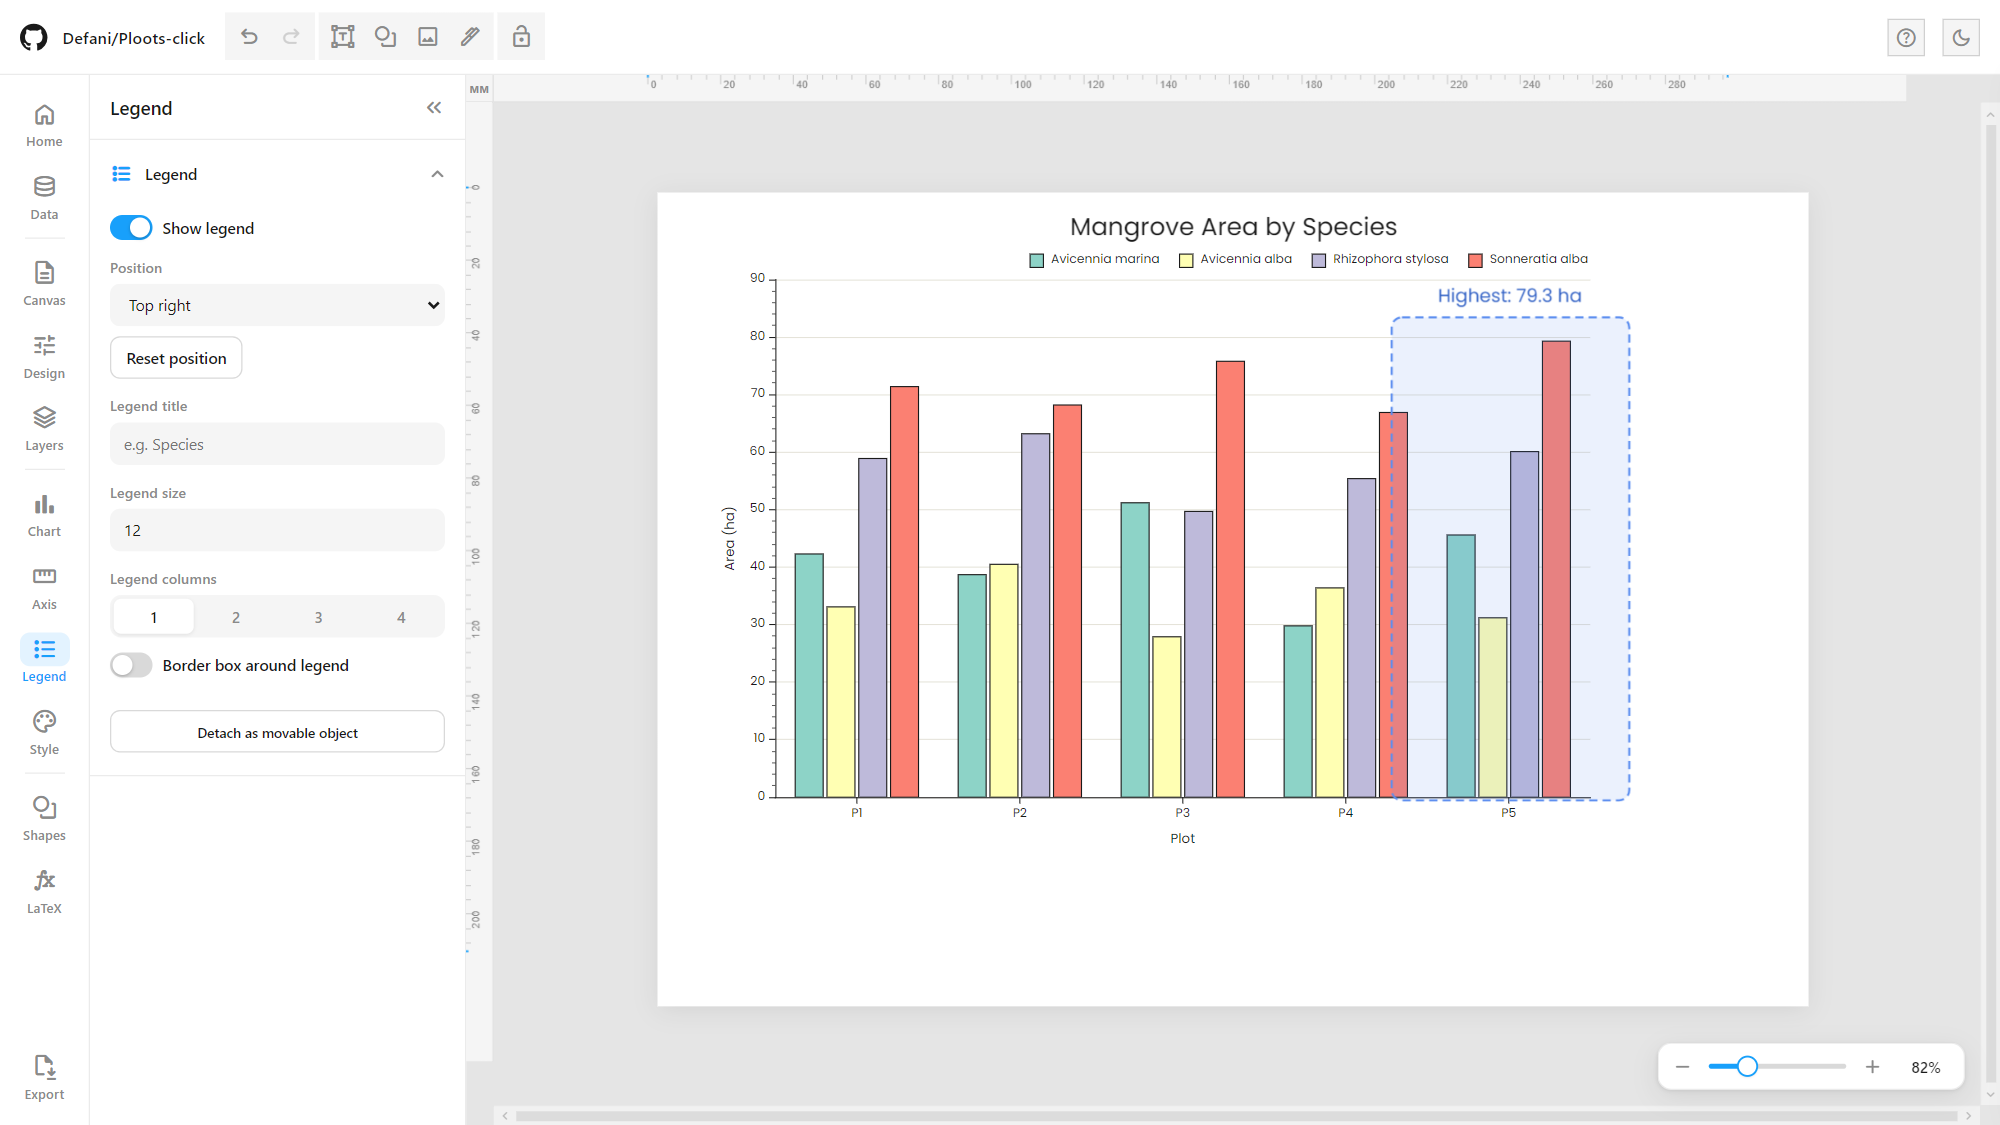
Legend: show/hide, 7 position presets, 1 to 4 columns, title, font size, border, drag it anywhere on the chart, or detach it into a free object on the page (pie, donut, funnel and treemap legends list their categories).
Value labels with formatting (auto, integer, 1 or 2 decimals, thousands separator, percent, currency), error bars (percent or fixed), bar gap/width controls, outline and frame toggles.
Chart gallery
Every chart type, rendered by the D3 engine from its built-in sample data (click an image to open it full size):
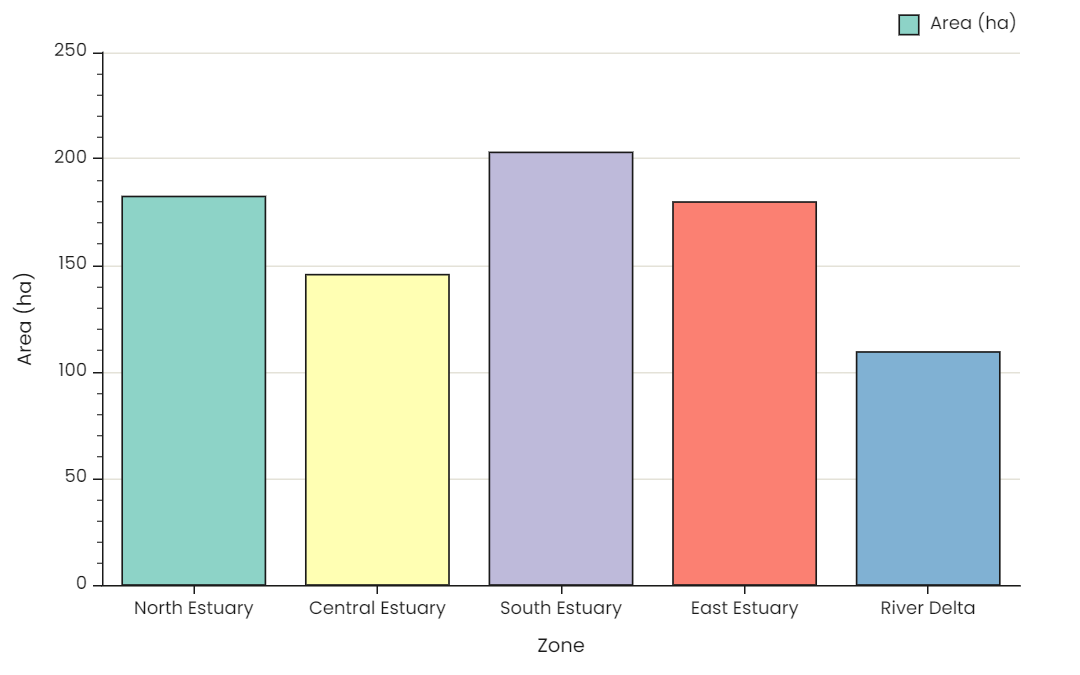 Bar – single | 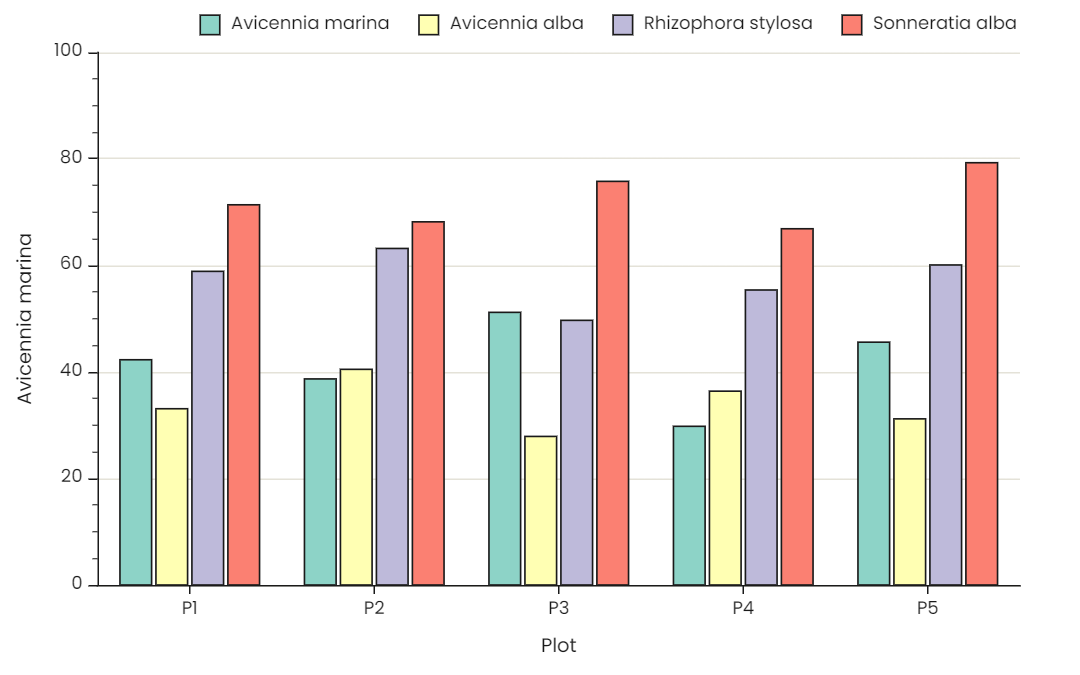 Bar – grouped | 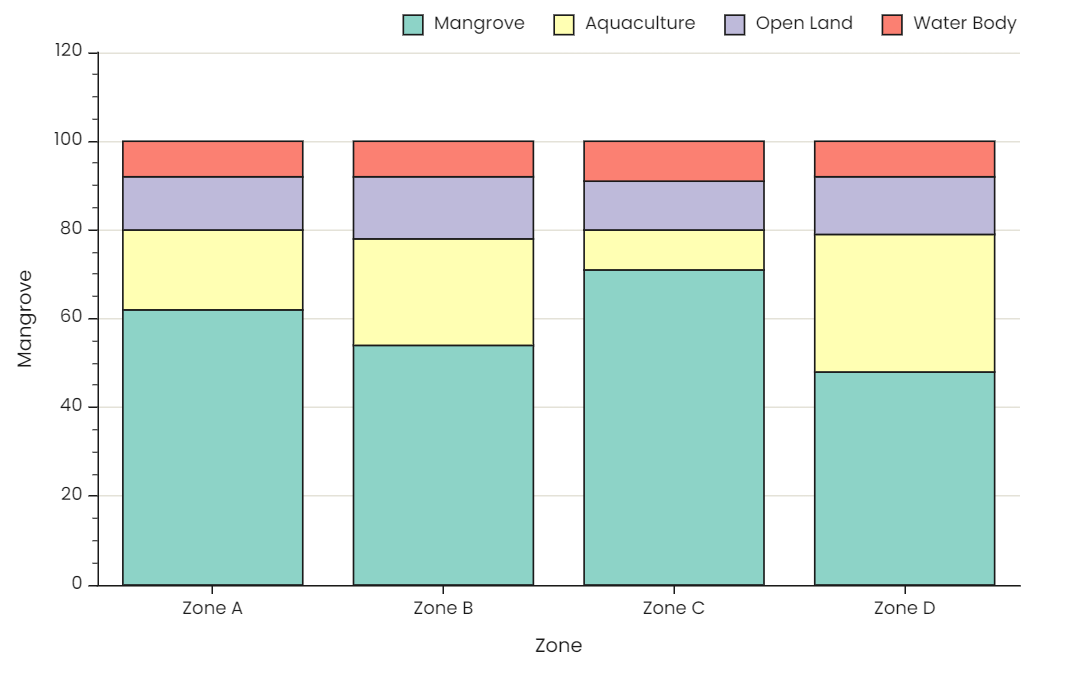 Bar – stacked |
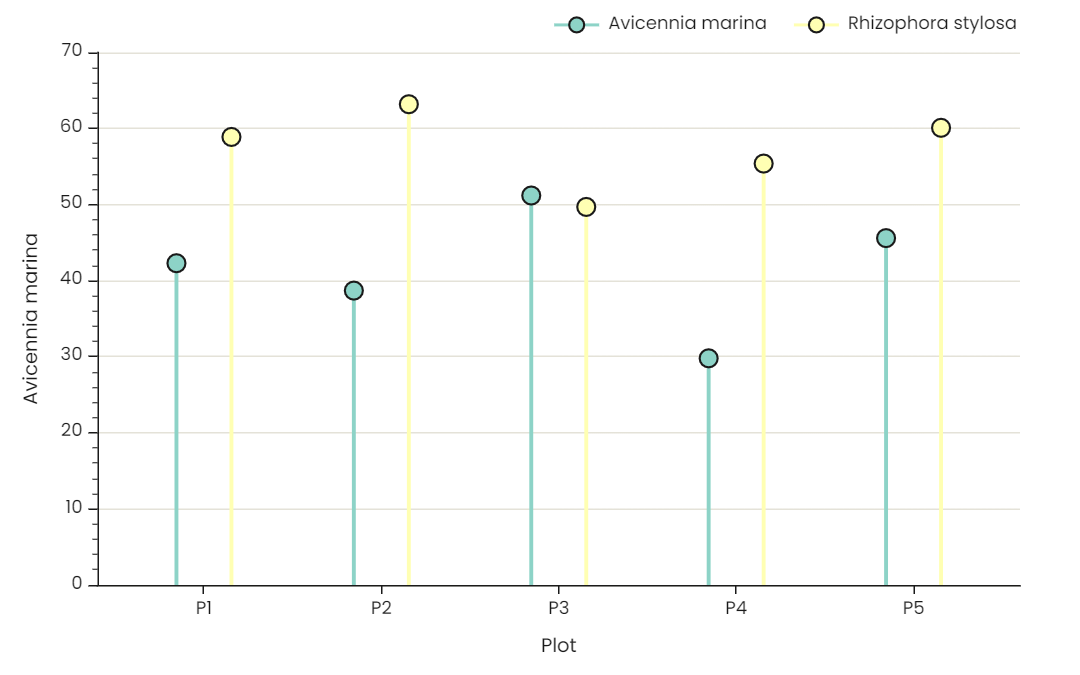 Lollipop | 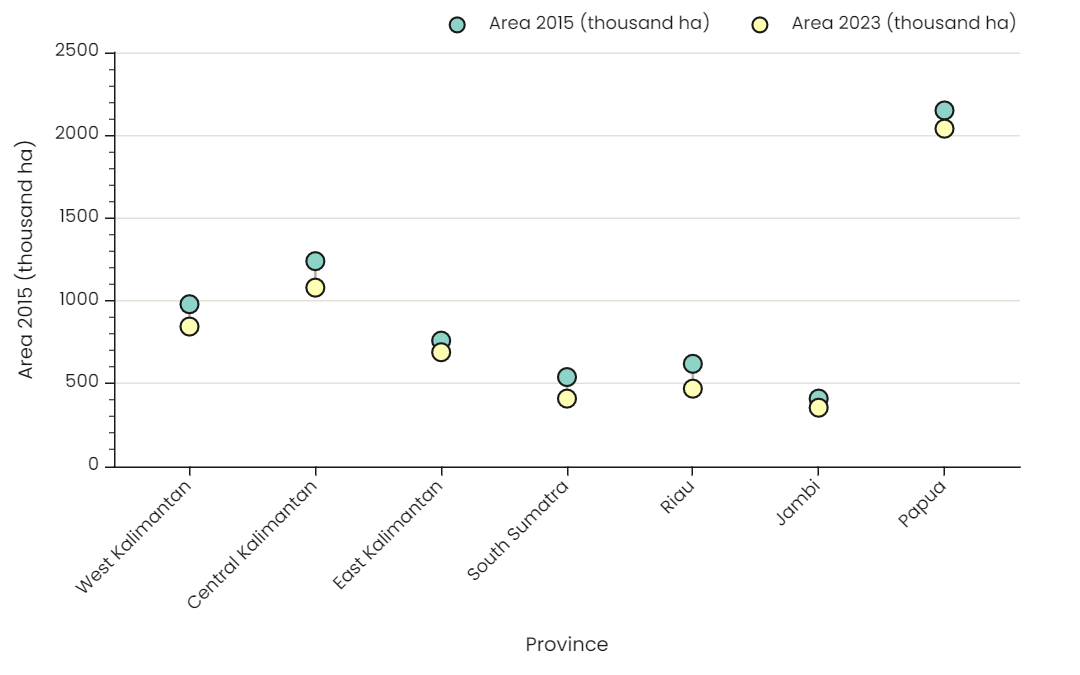 Dumbbell / slope | 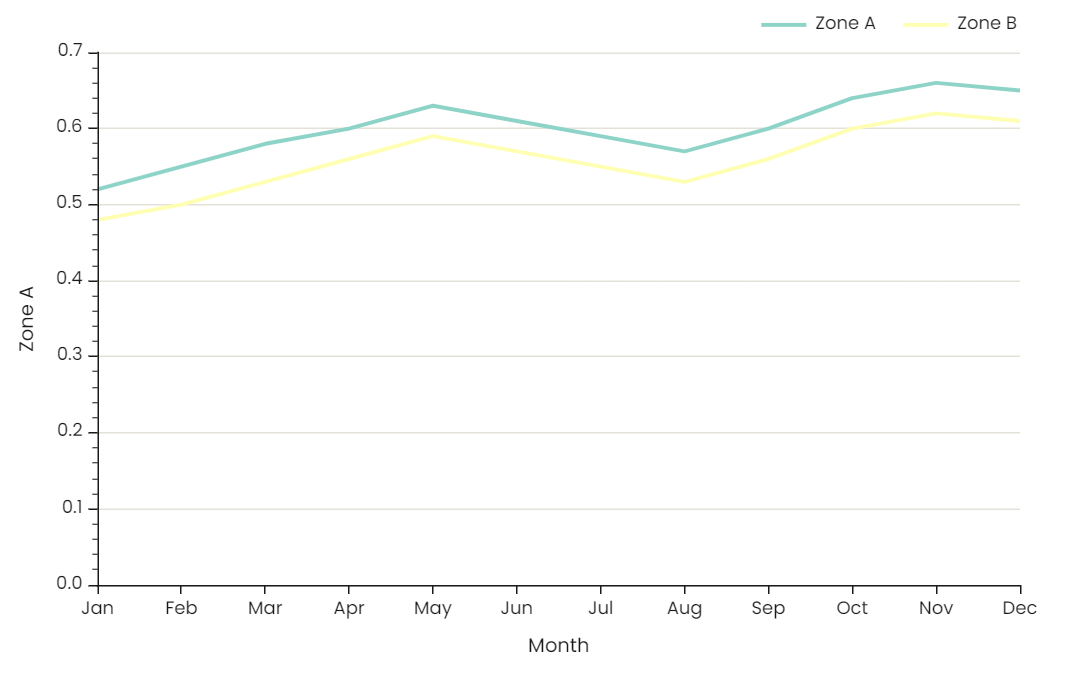 Line |
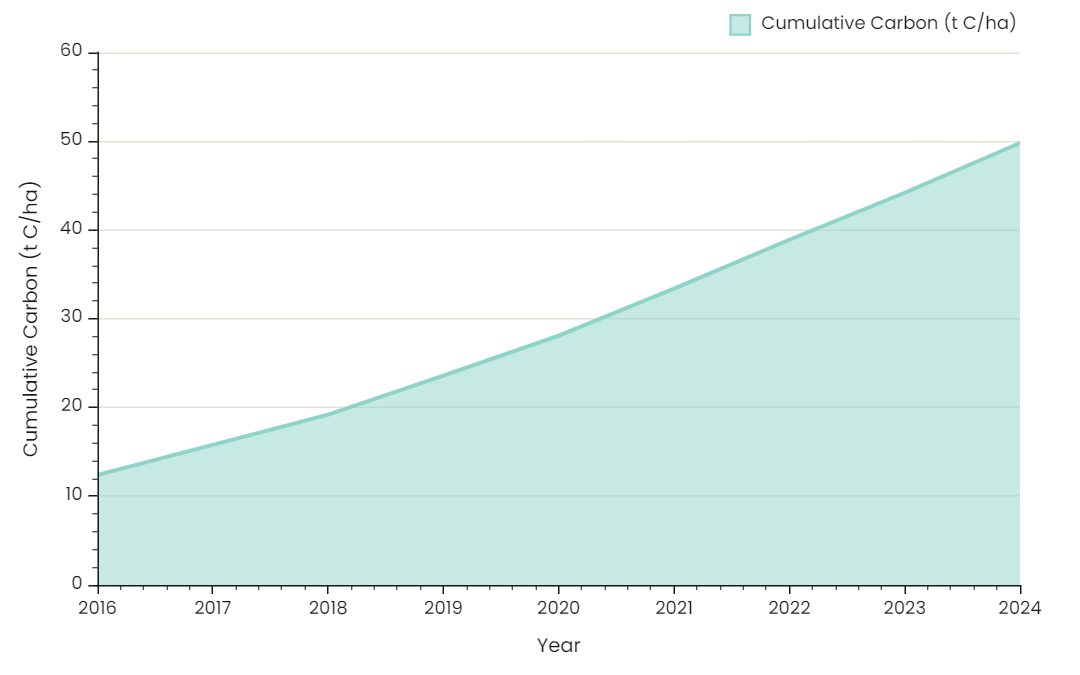 Area | 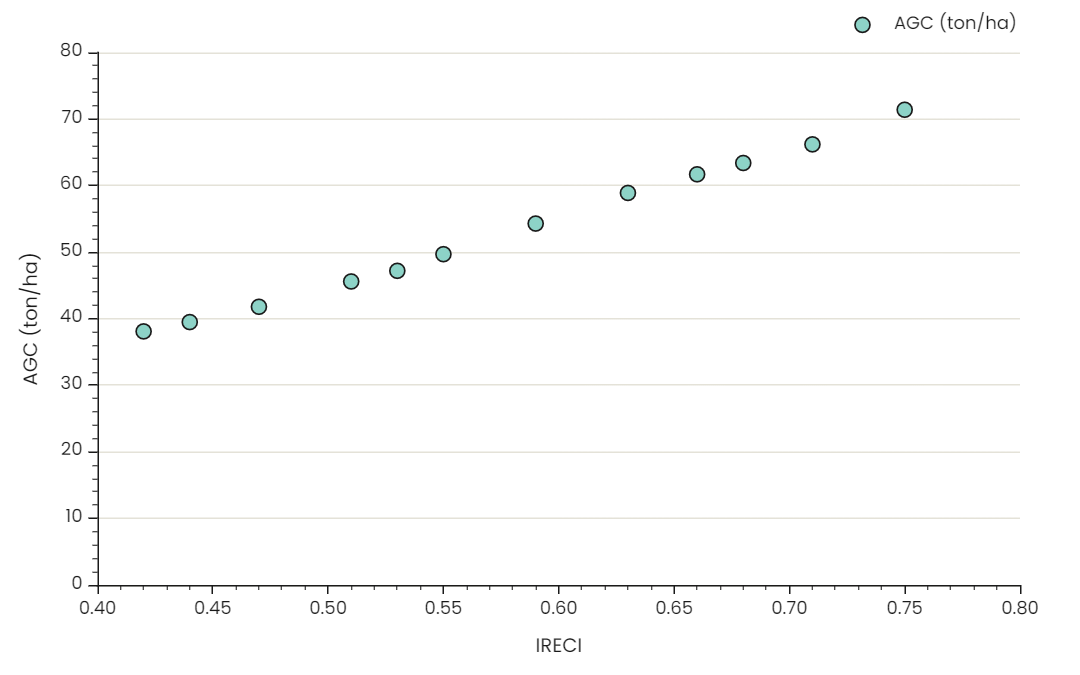 Scatter | 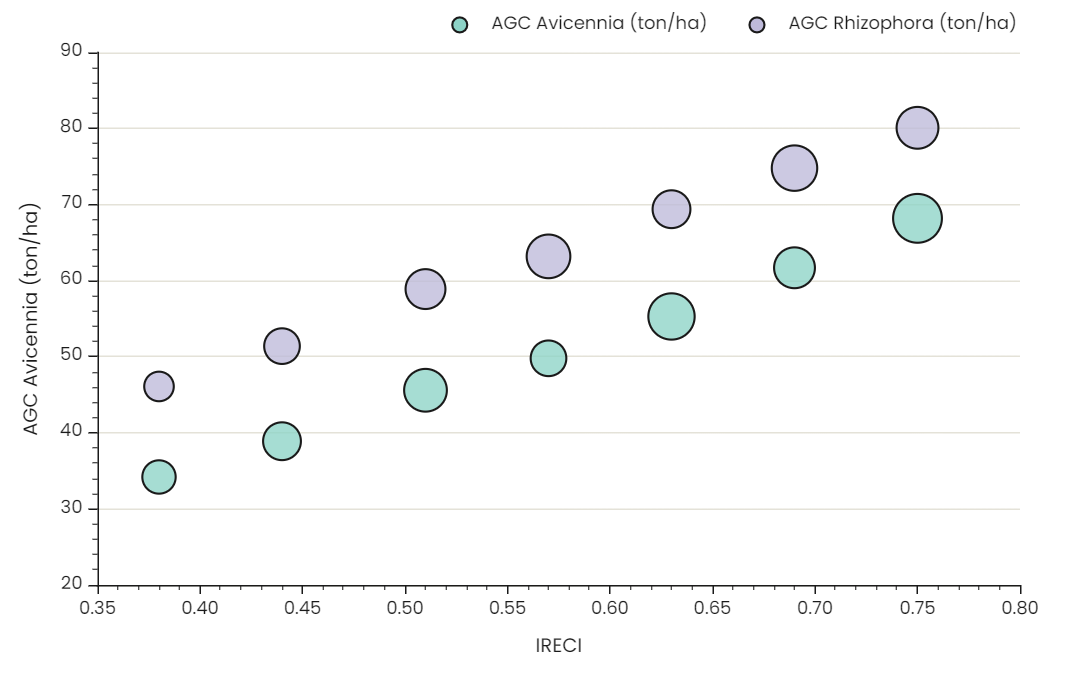 Bubble |
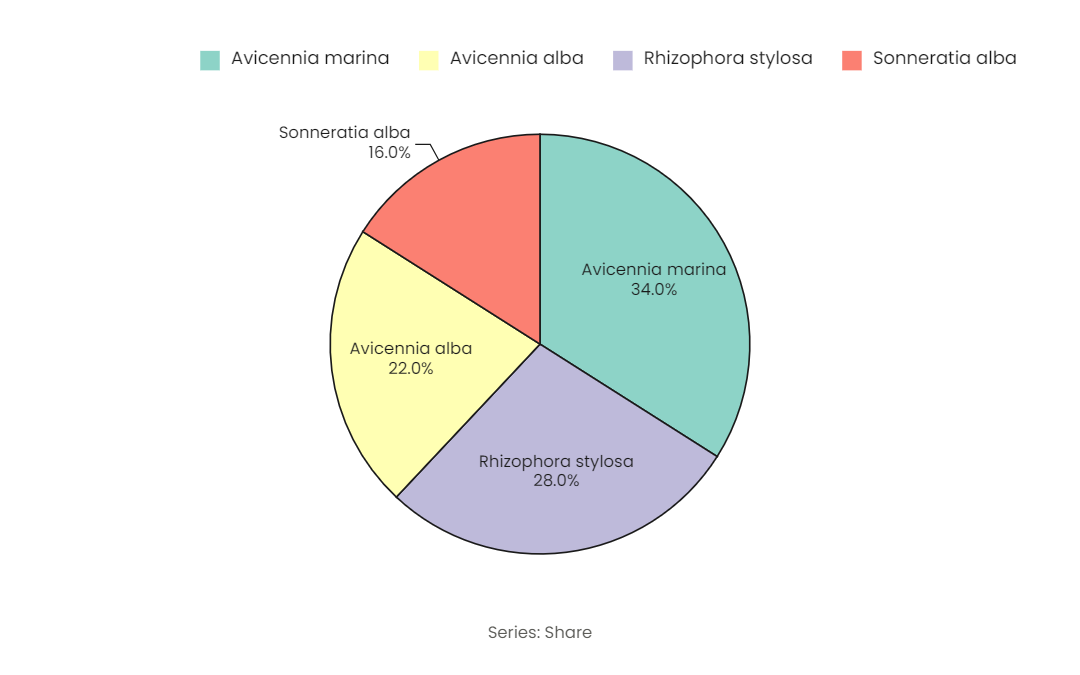 Pie | 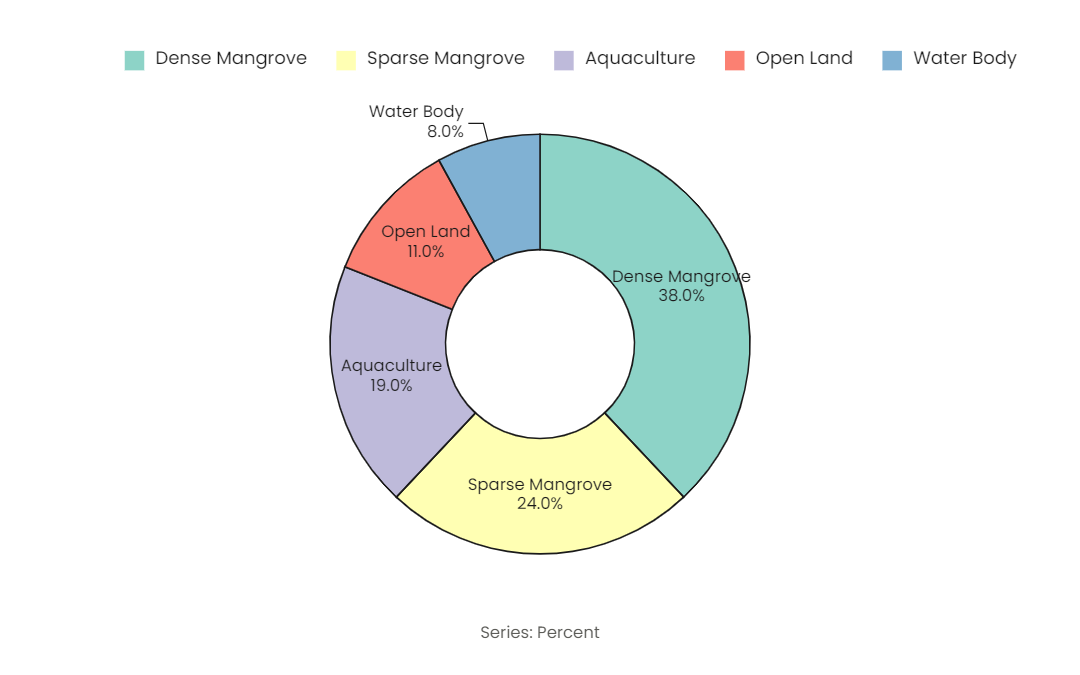 Donut | 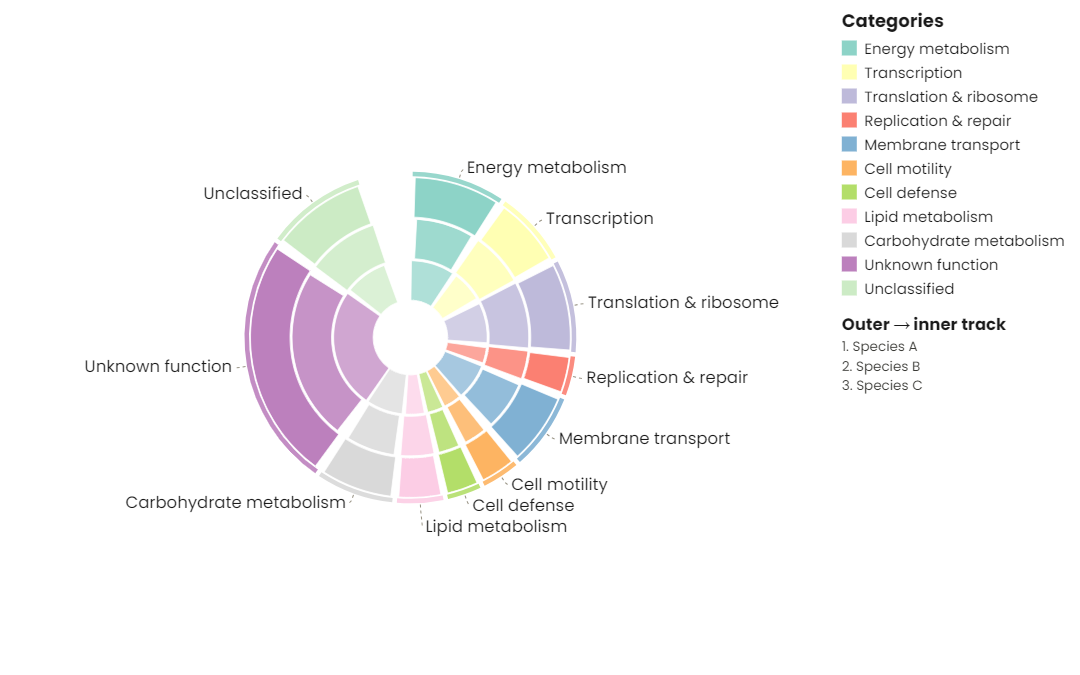 Radial rings |
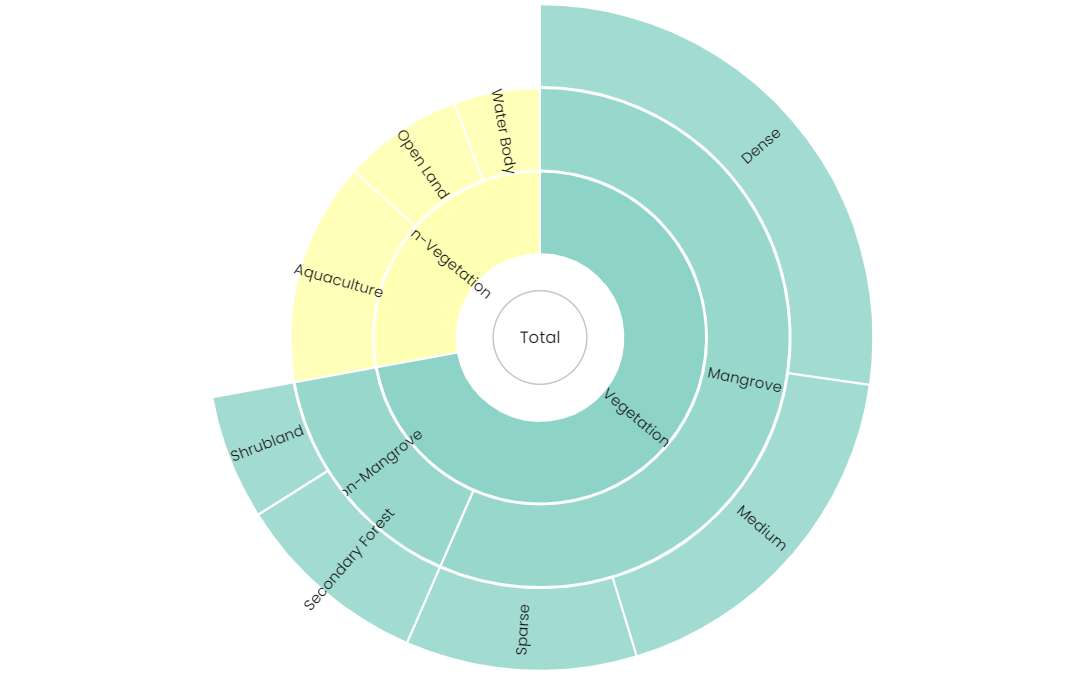 Sunburst | 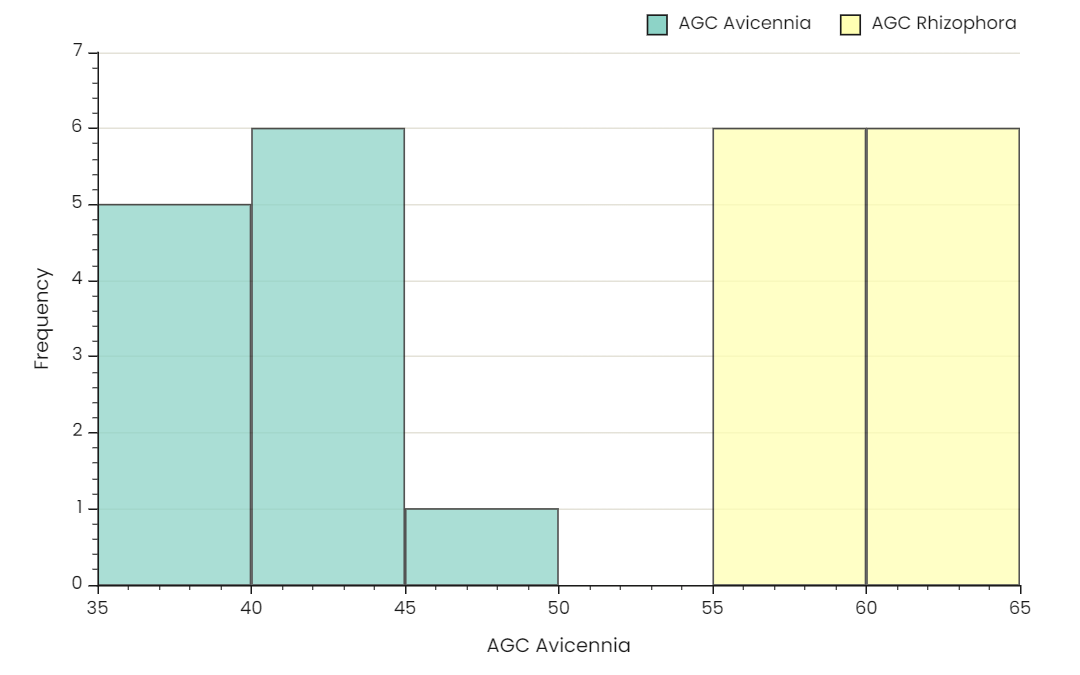 Histogram | 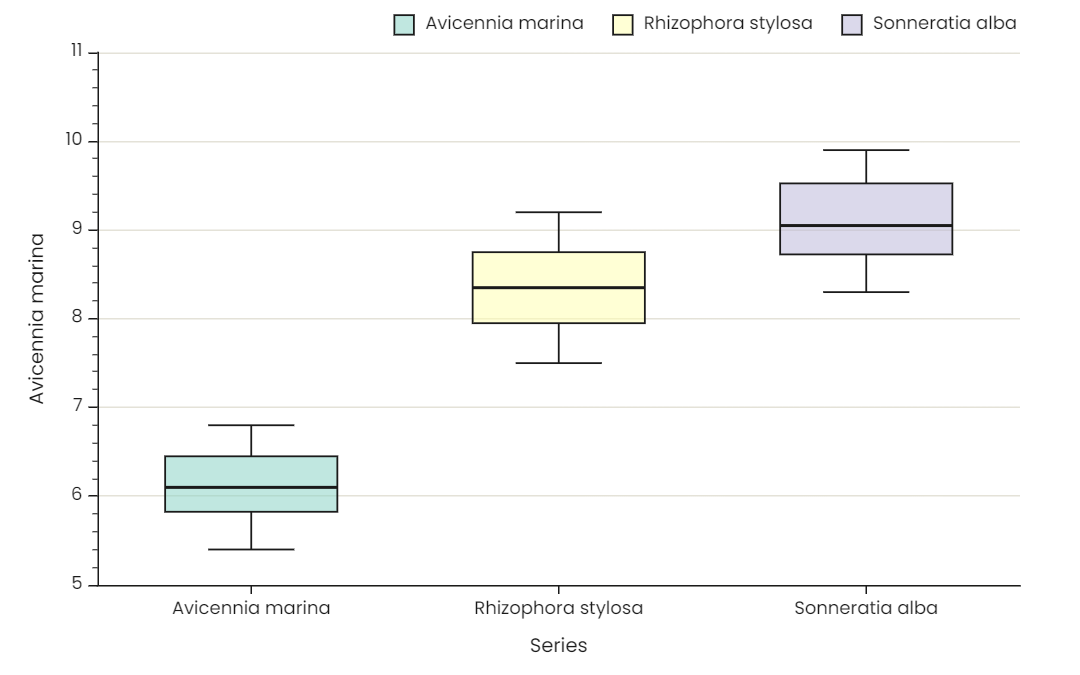 Box plot |
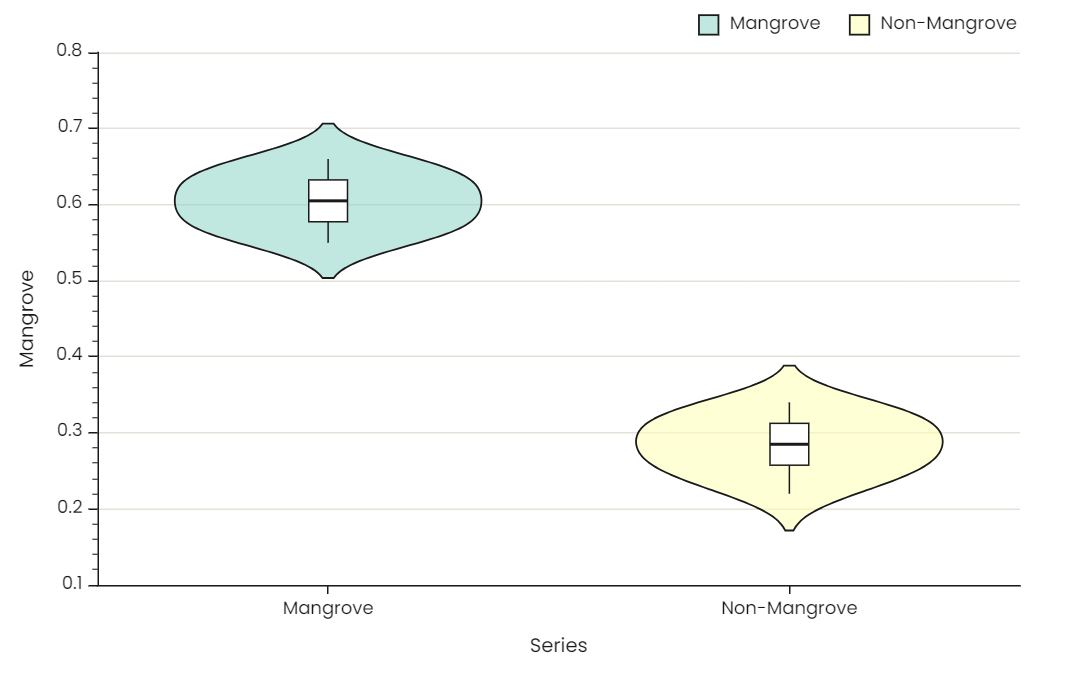 Violin plot | 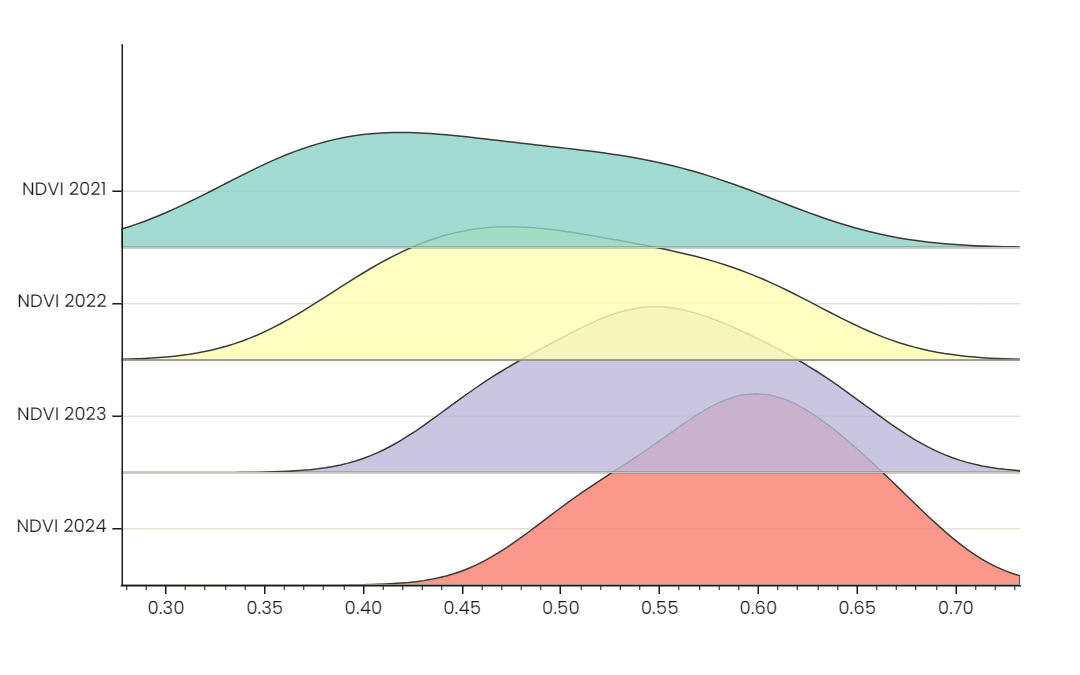 Ridge plot | 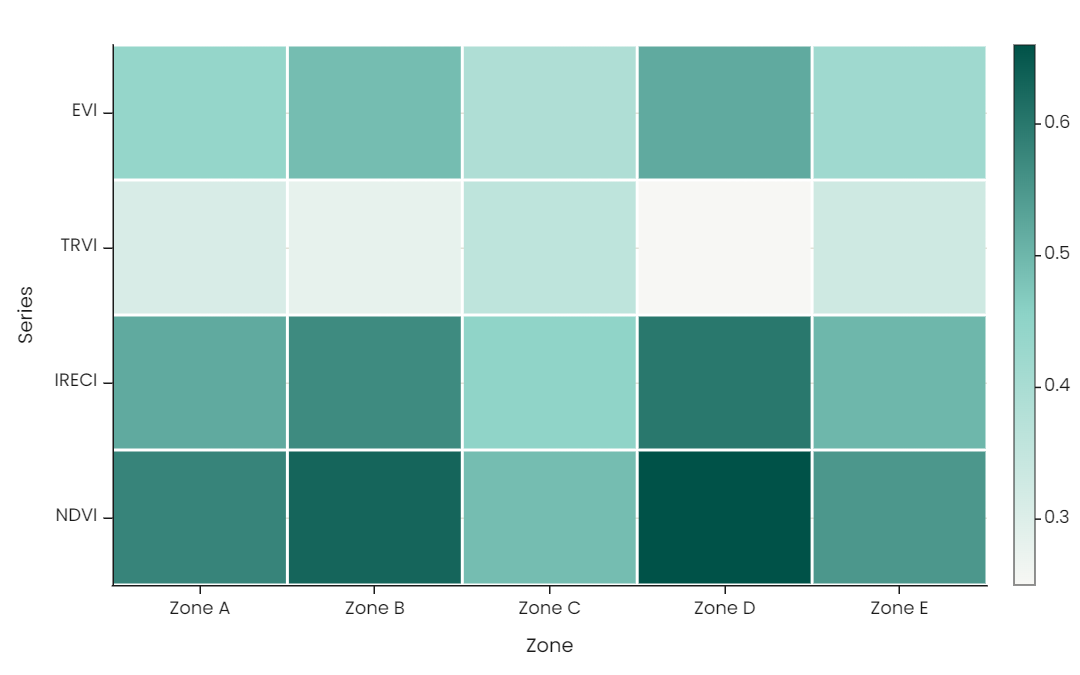 Heatmap |
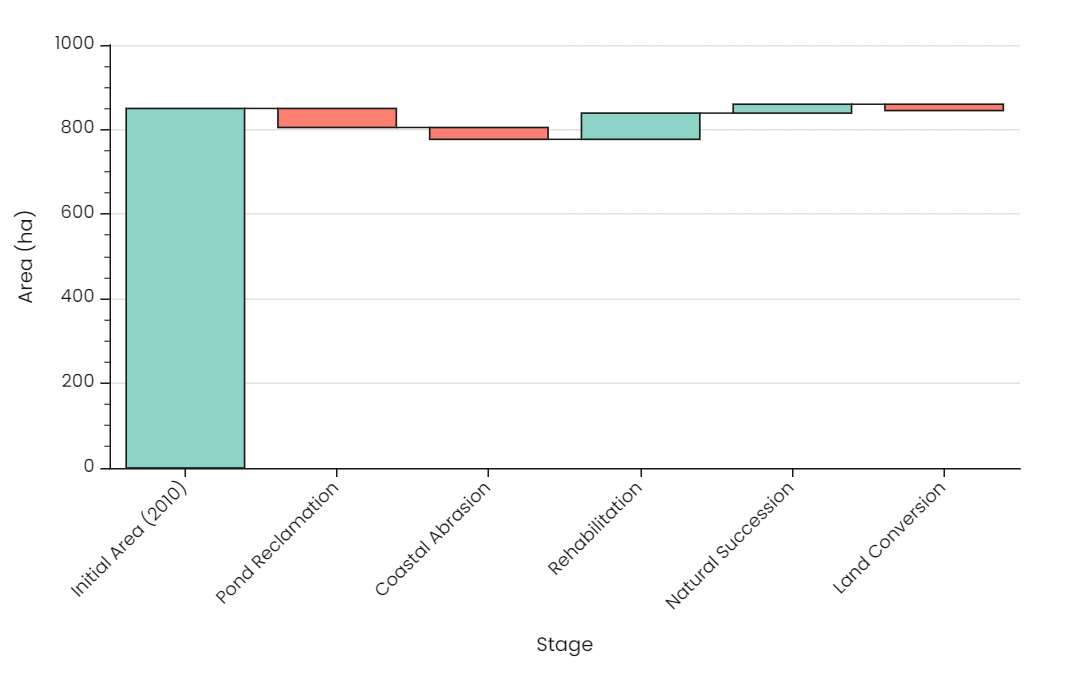 Waterfall | 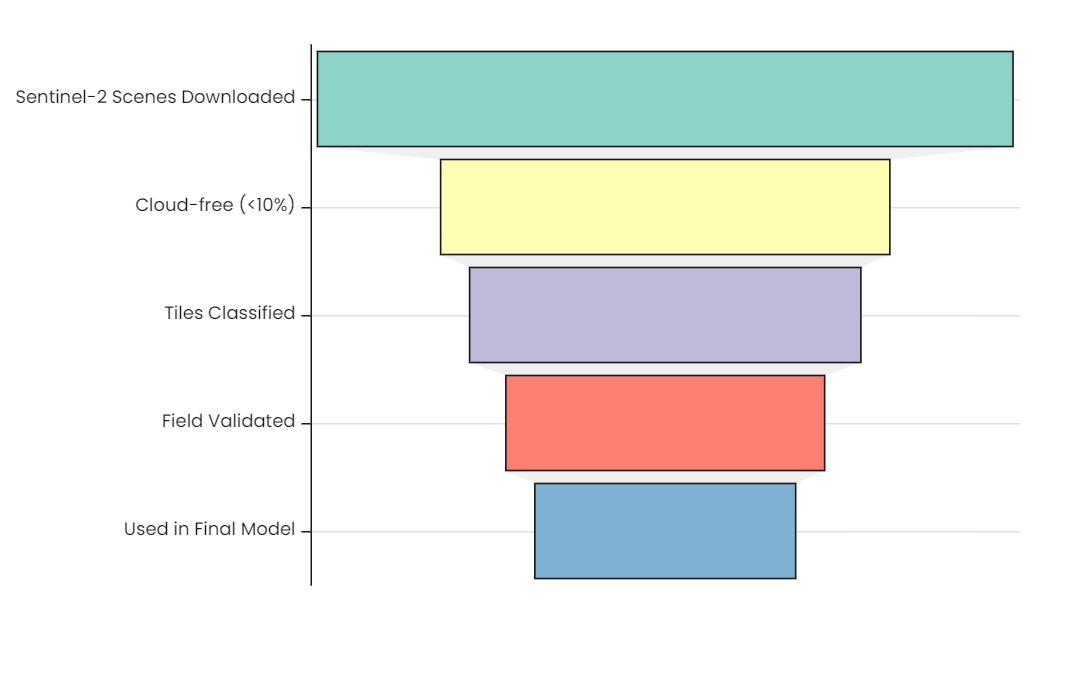 Funnel | 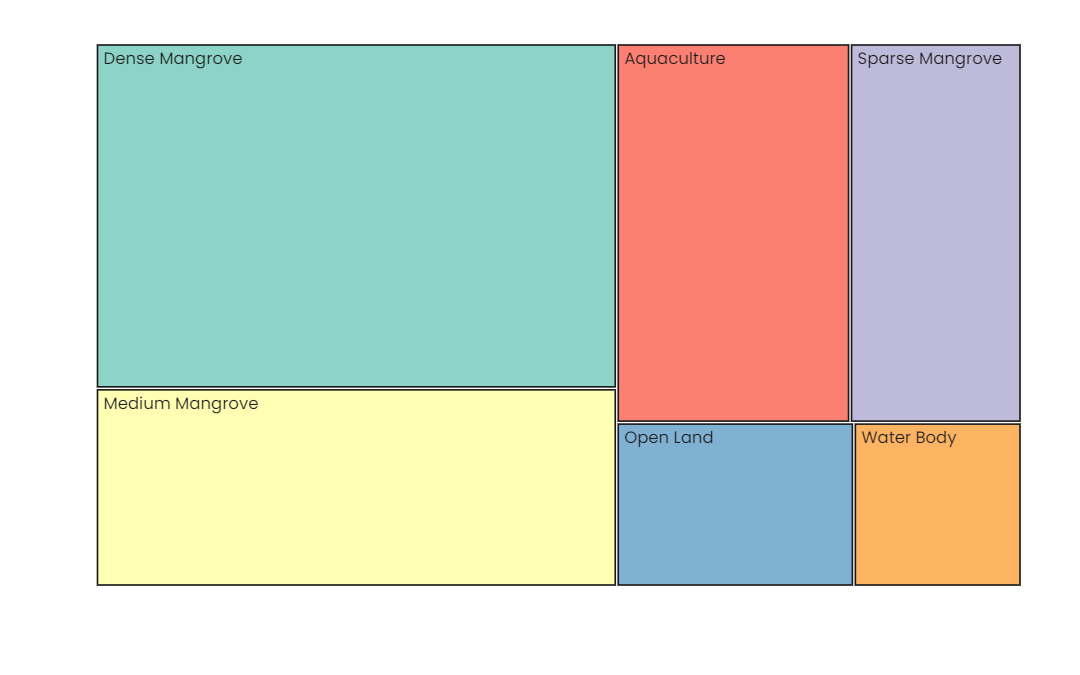 Treemap |
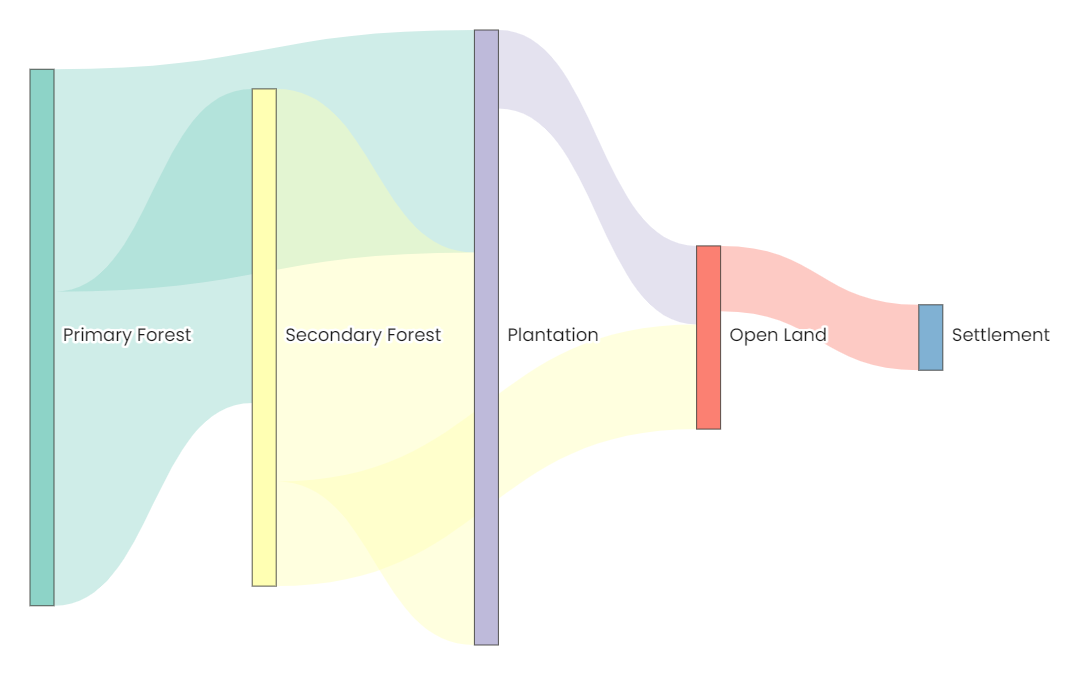 Sankey | 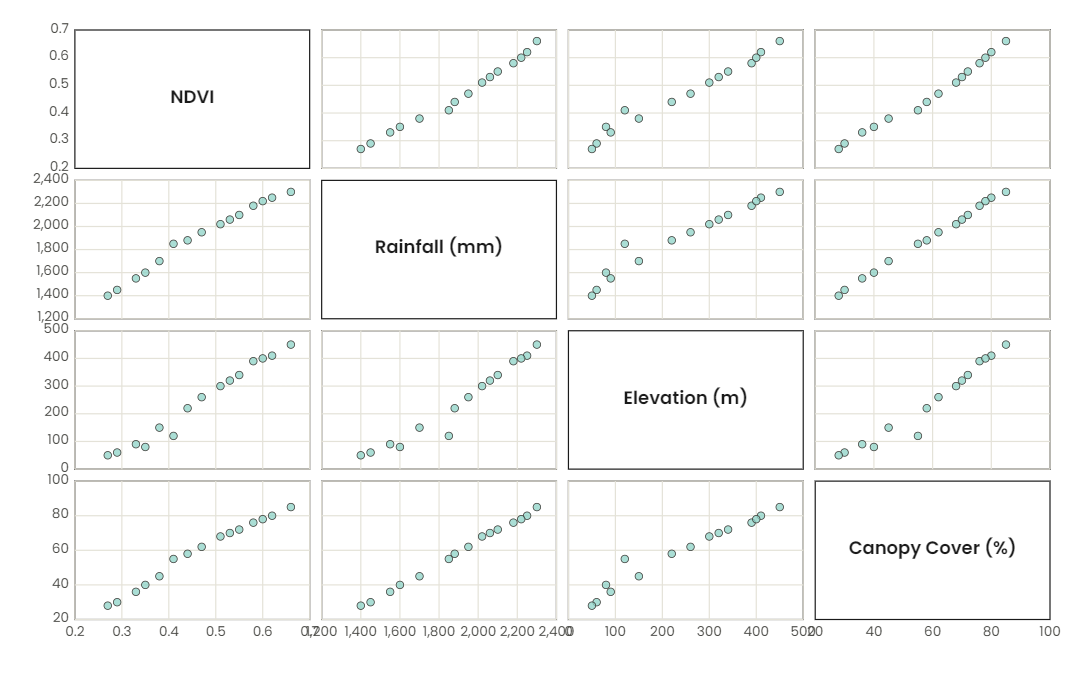 Scatter matrix | 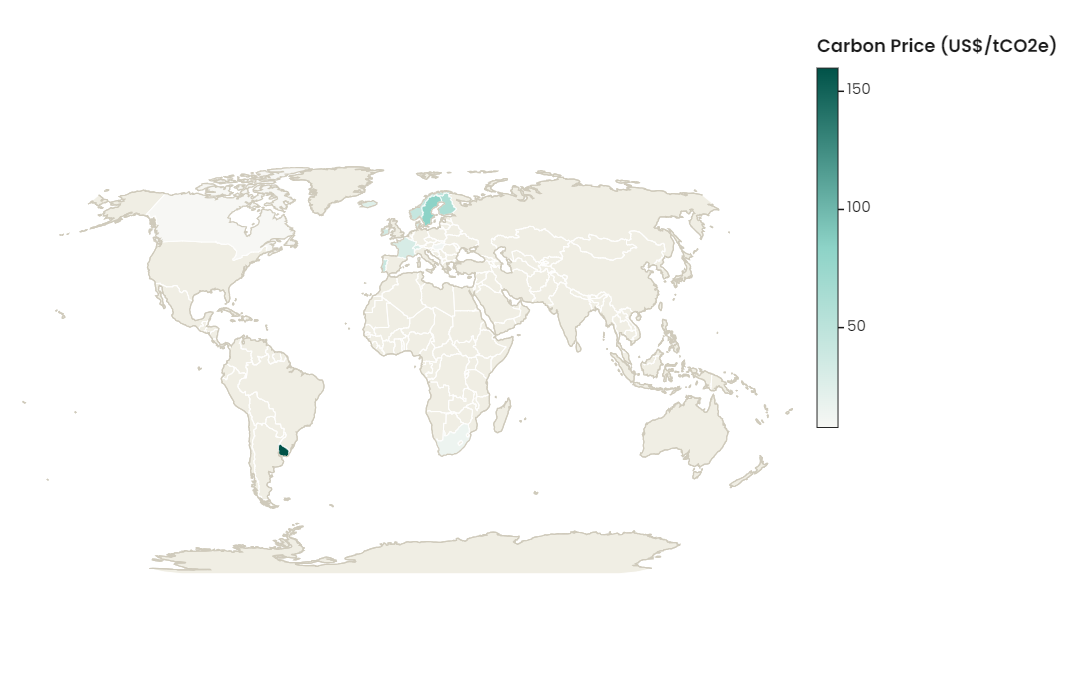 Choropleth map |
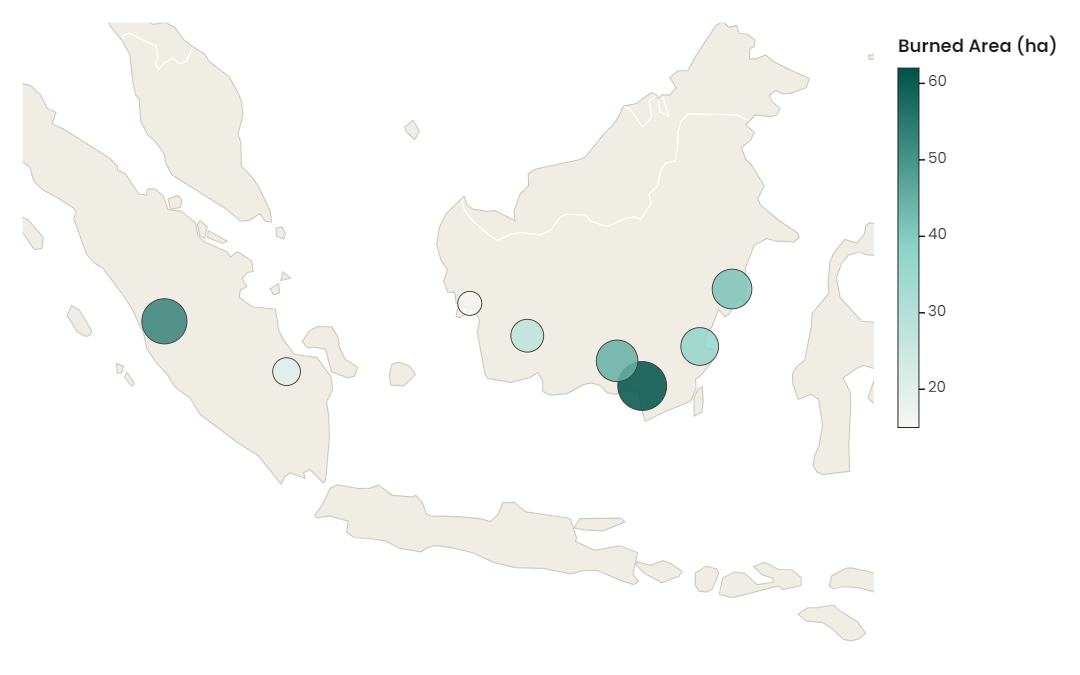 Bubble map |
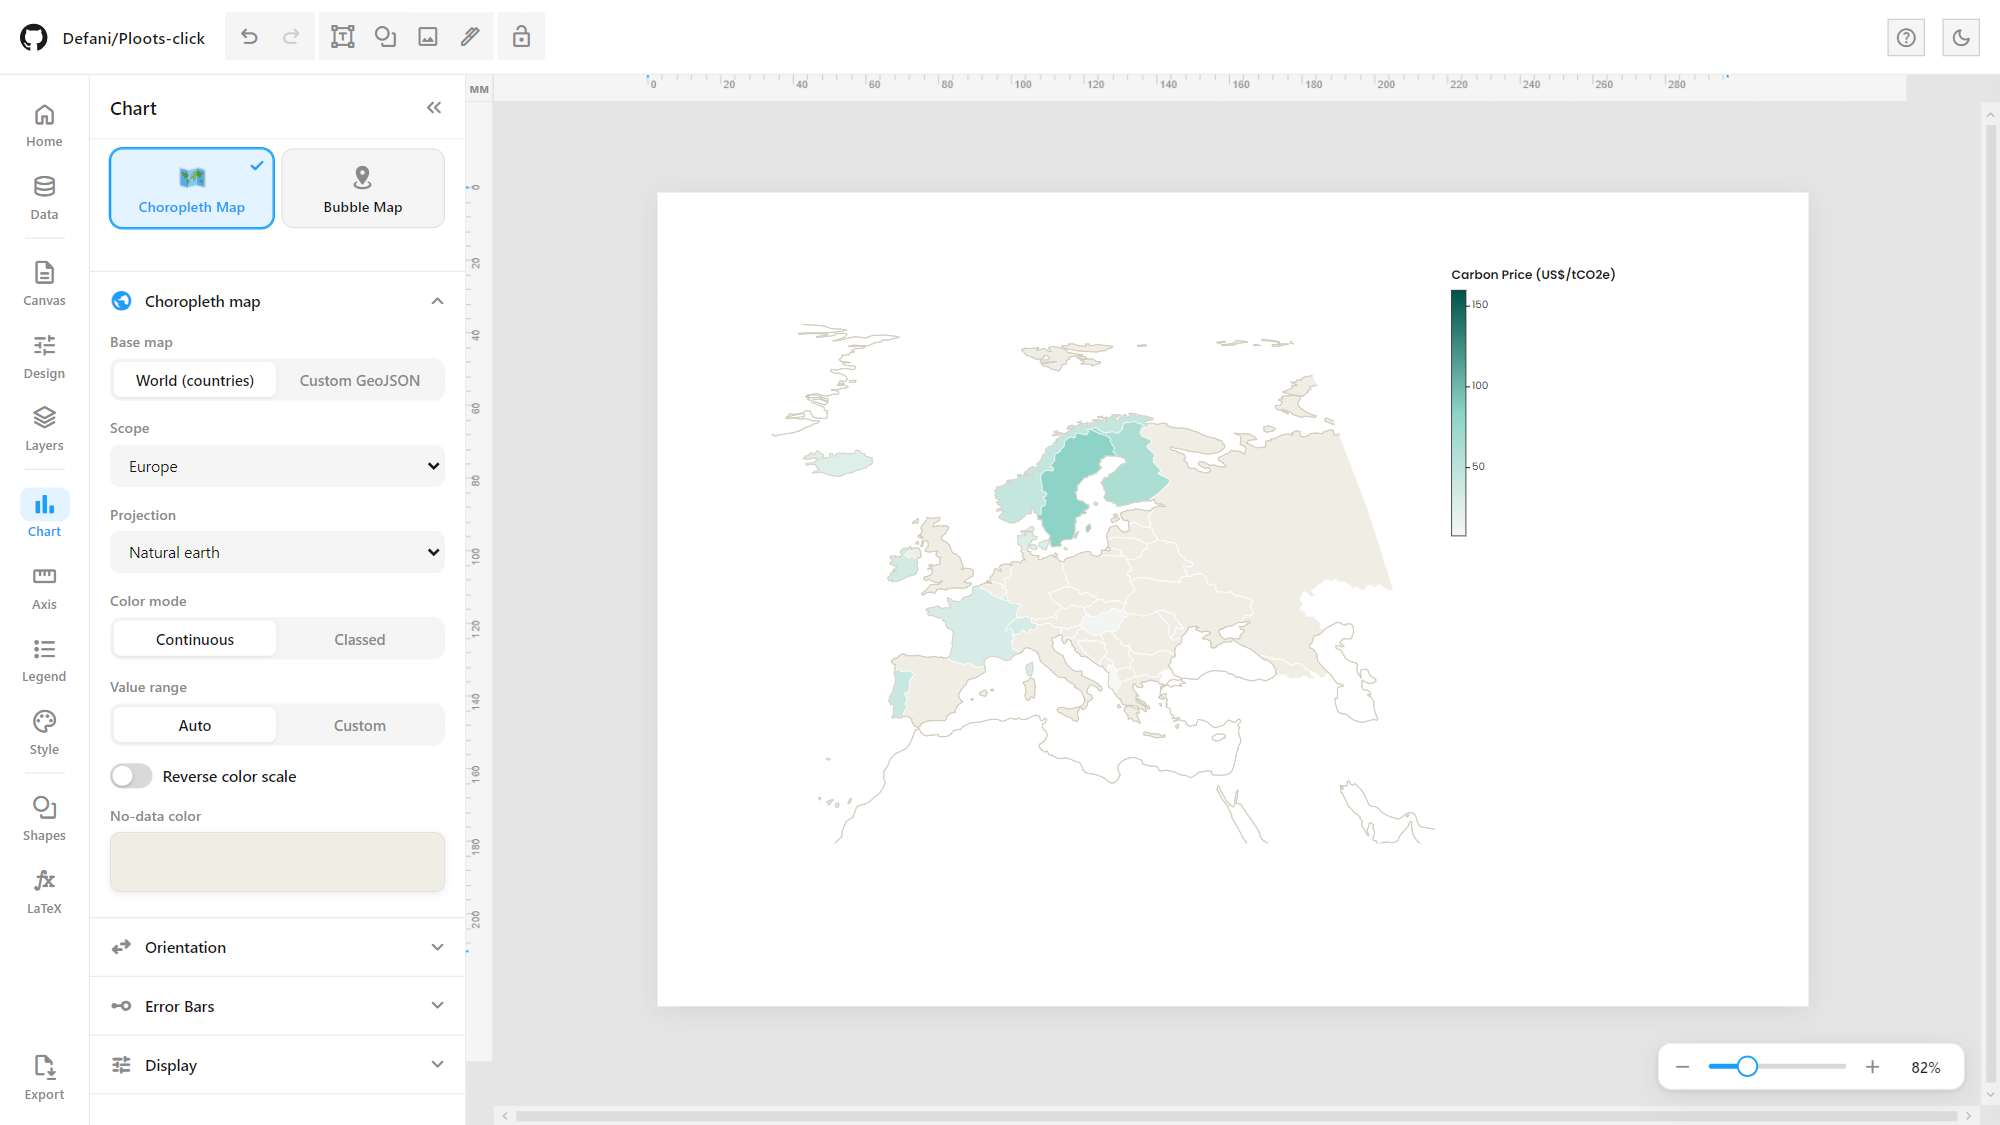
Map settings: base map (world or custom GeoJSON), scope, projection, continuous or classed colour, value range.
Data View
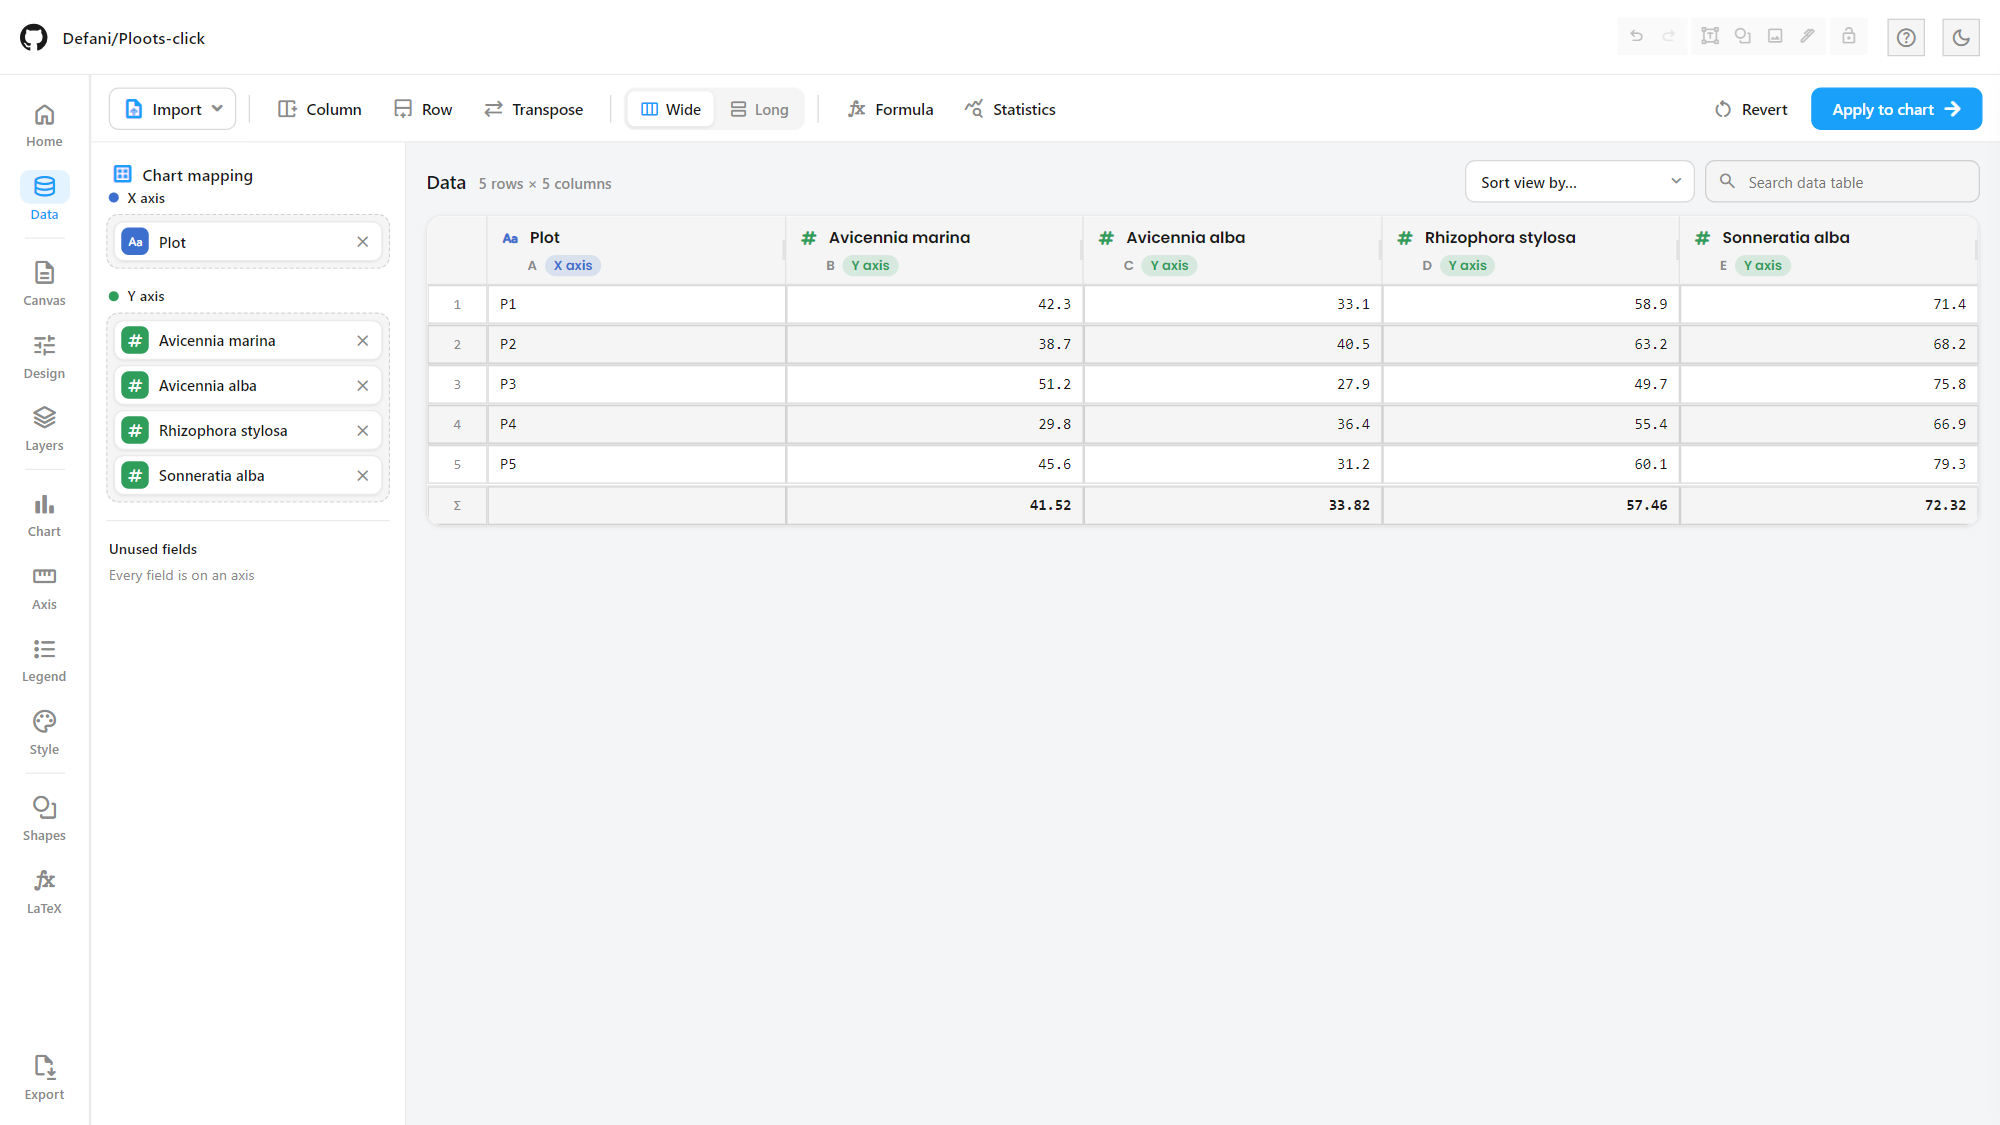
A spreadsheet-style table (AG Grid), separate from the applied chart data: edit cells, rename columns, add rows/columns, paste from Excel or Sheets, sort and search.
Chart mapping shelves: drag fields onto the X and Y axes to decide what the chart plots; fields left off both shelves are listed as unused.
Wide ↔ long/tidy reshaping, transpose, spreadsheet formulas (
=SUM(A1:A5),=AVERAGE(...), cell references) and per-column Statistics, with a Σ summary row.Revert discards the edits; Apply to chart sends the table to the chart.
Editor: toolbars, Design panel & layers
Canva-style floating toolbar. Selecting text shows its format bar above the canvas (font, size, colour, bold/italic/underline/strike, case, alignment, lists, super/subscript, line spacing, opacity, effects, position), plus a small action bar next to the object (duplicate, lock, delete, more):
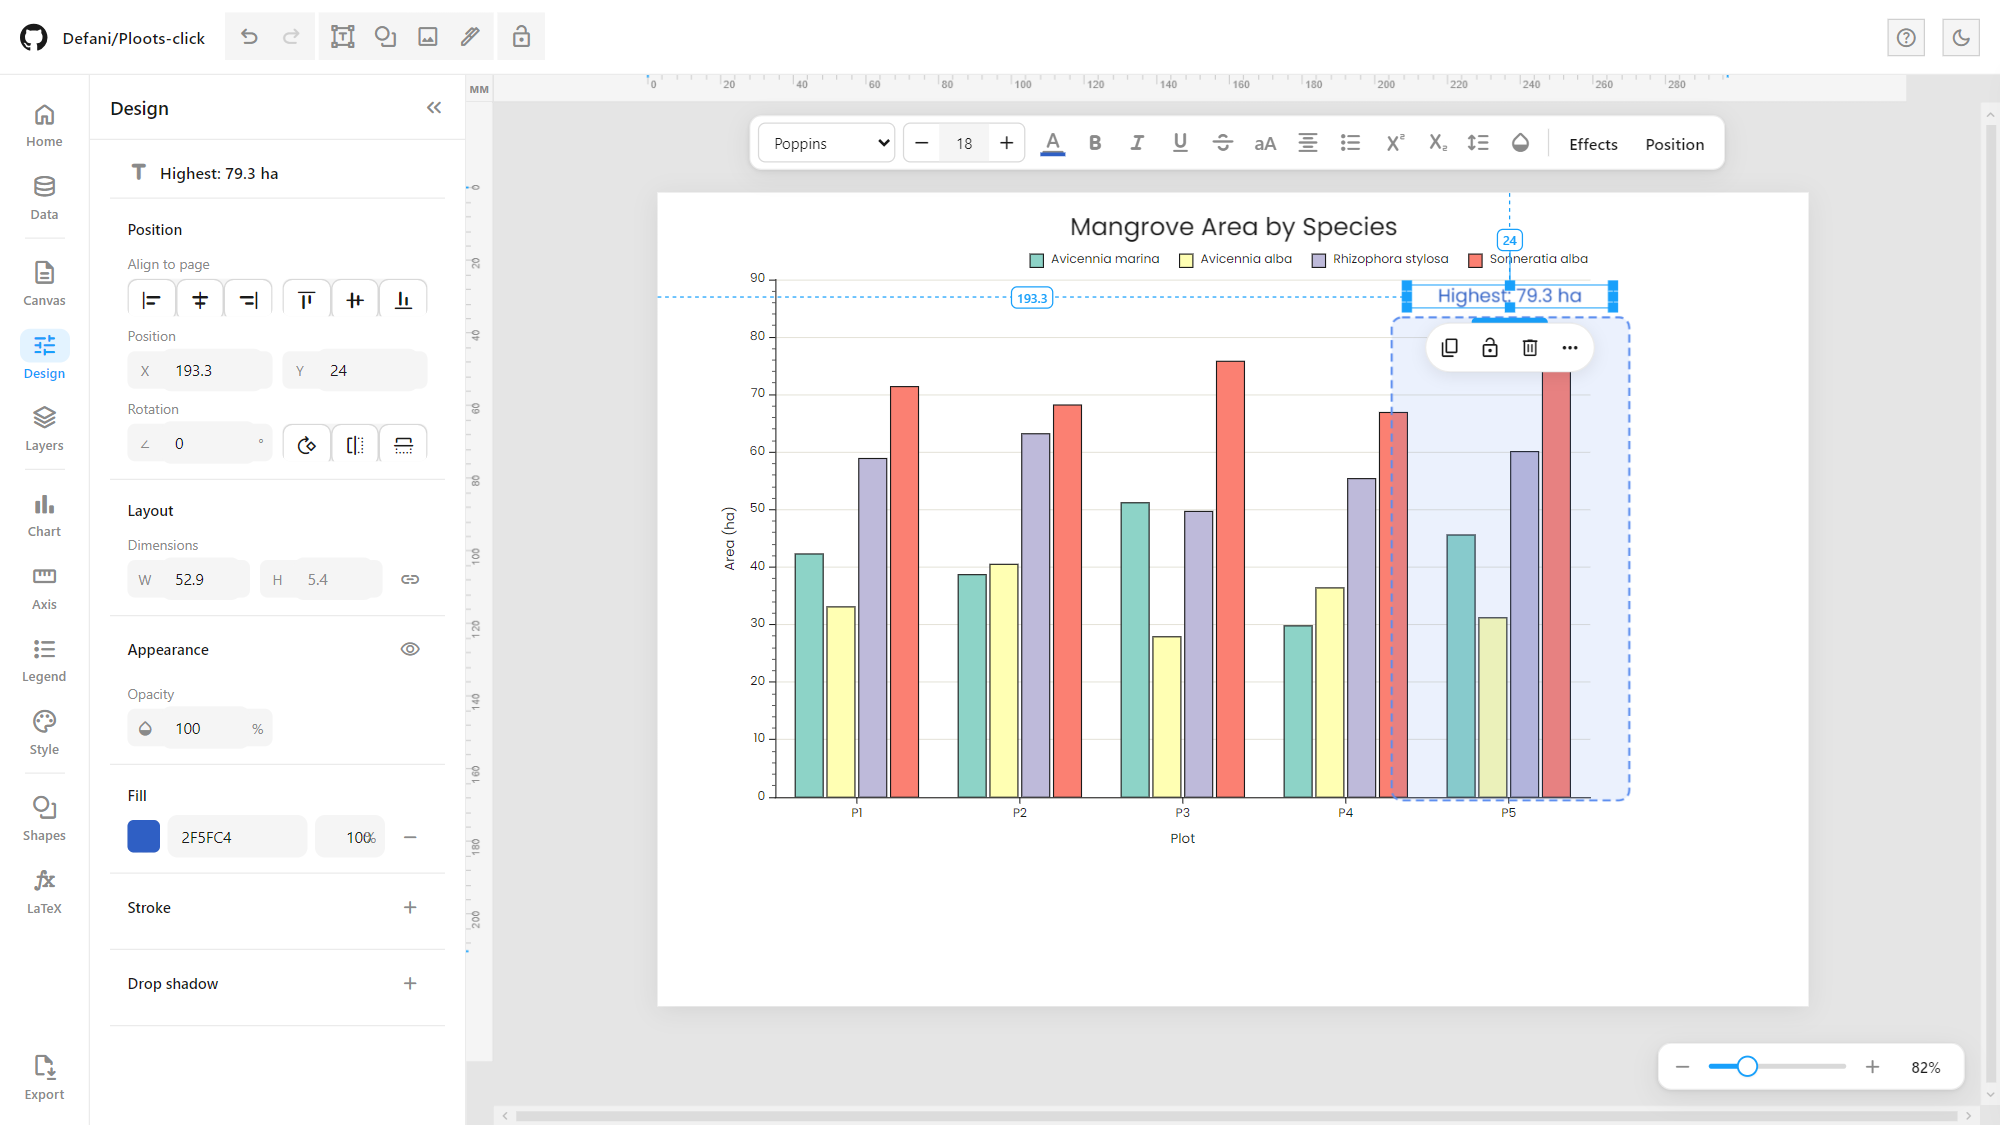
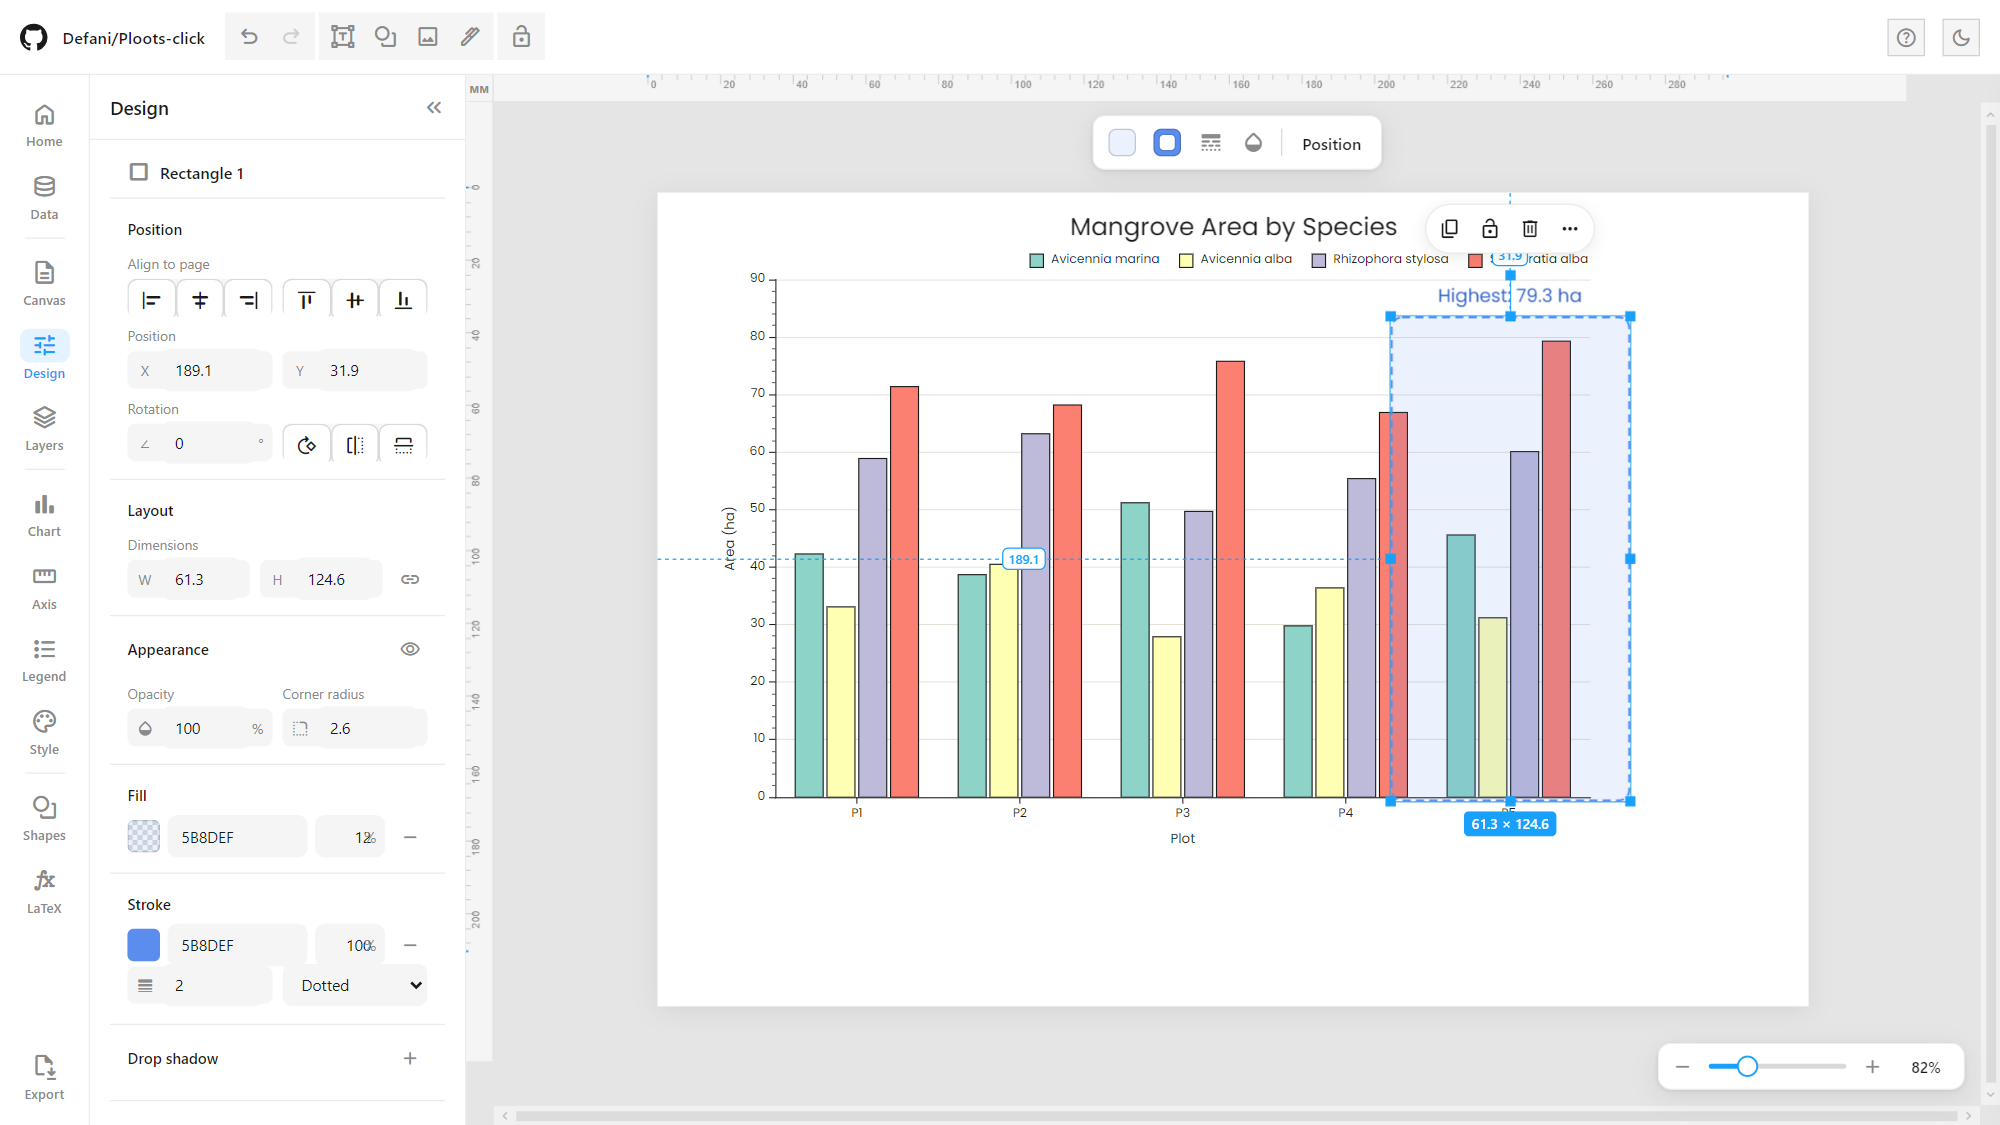
Shapes and other objects get the same kind of floating bar (fill, stroke, dash, opacity, position). A Figma-style size badge (W × H) sits under the selection, with dashed distance guides to the page’s left and top edges. The Design panel edits position, alignment to the page, rotation and flips, size (with a proportion lock), opacity, corner radius, fill, stroke and drop shadow:
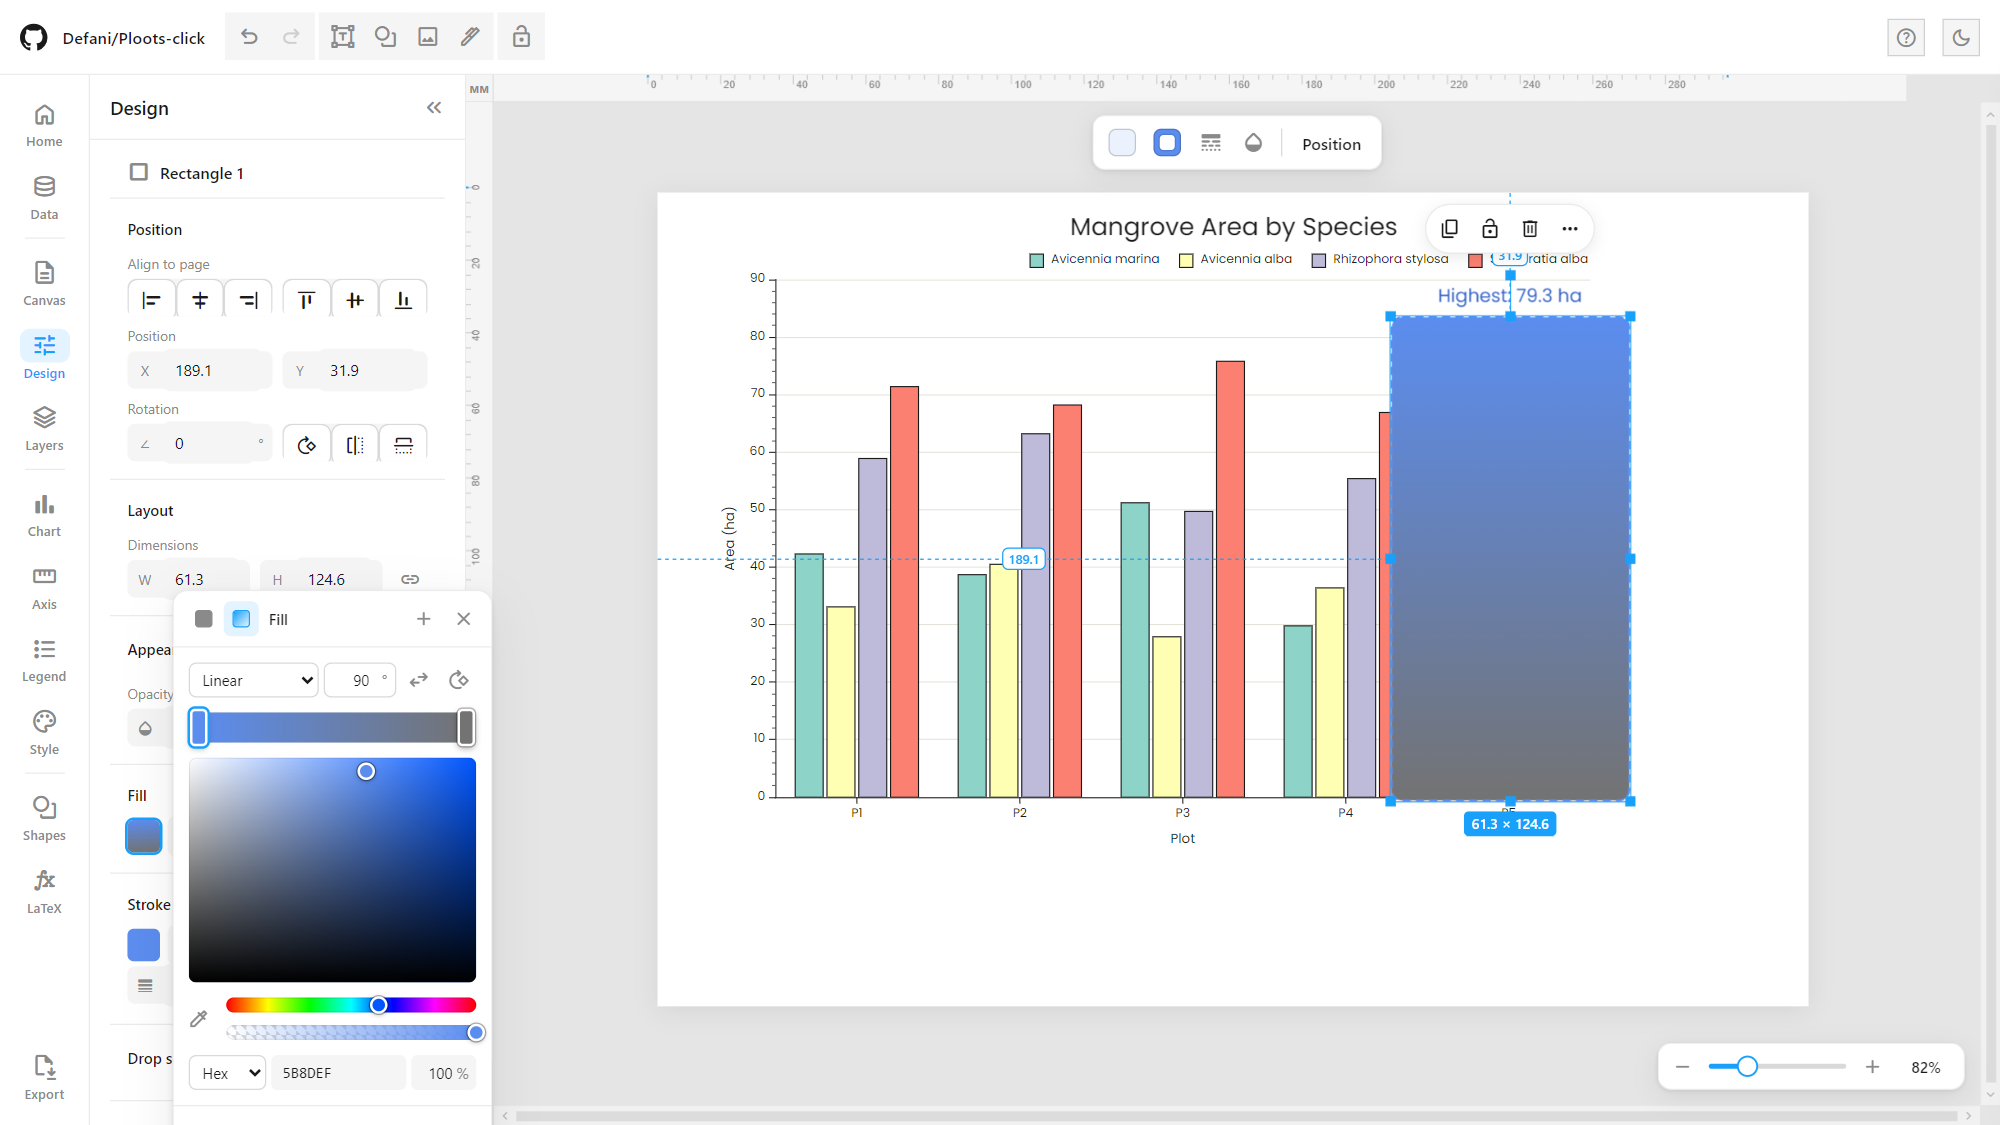
Advanced colour picker with solid or gradient fills (linear/radial, angle, draggable colour stops), HSV area, hue and alpha sliders, Hex/RGB/HSL input, an eyedropper, saved swatches and the colours already used on the page:
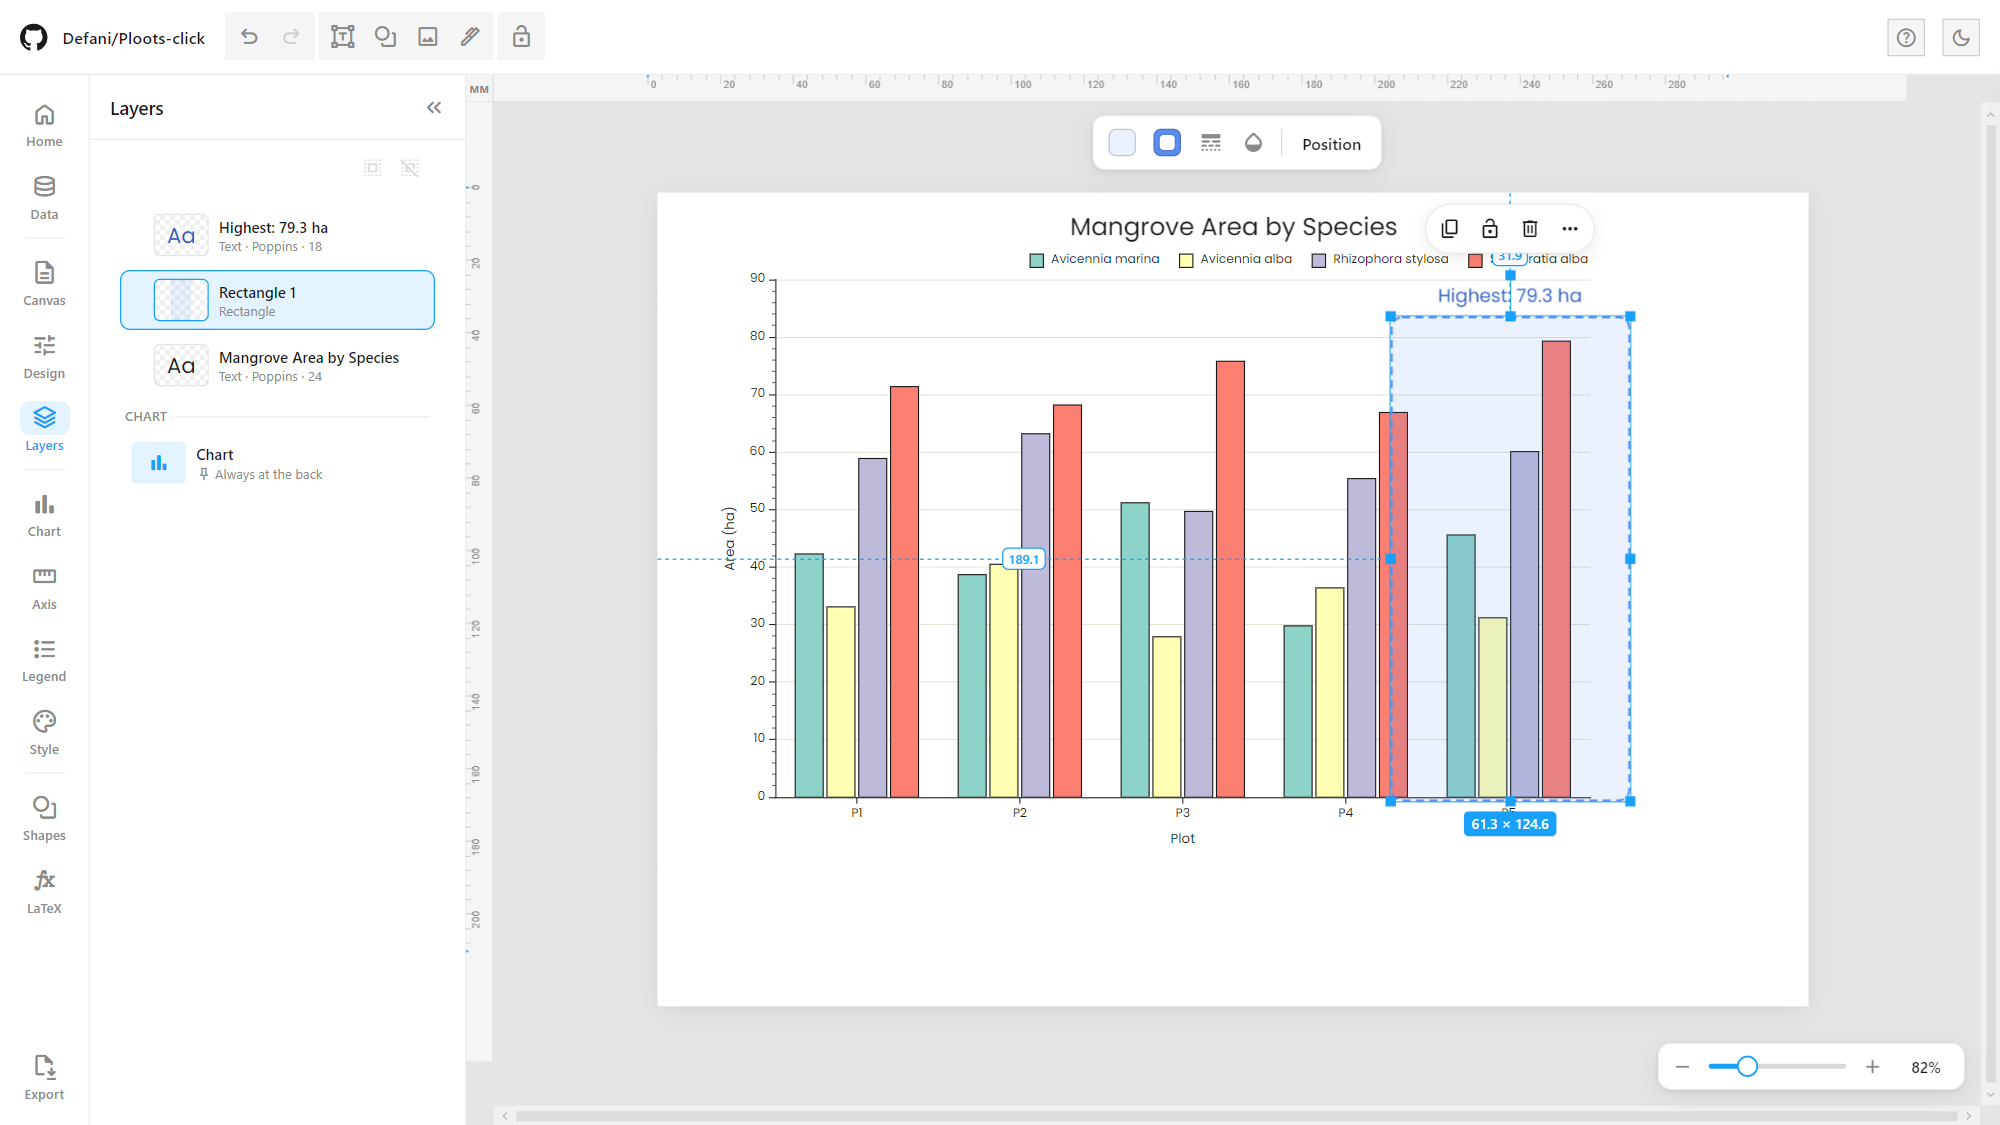
Layers lists every object on the page (with thumbnails, type and font details): drag to reorder, rename, hide, lock, and group/ungroup. The chart itself always stays at the back:
Sidebar panels for the axes, style and legend:
 Axis | 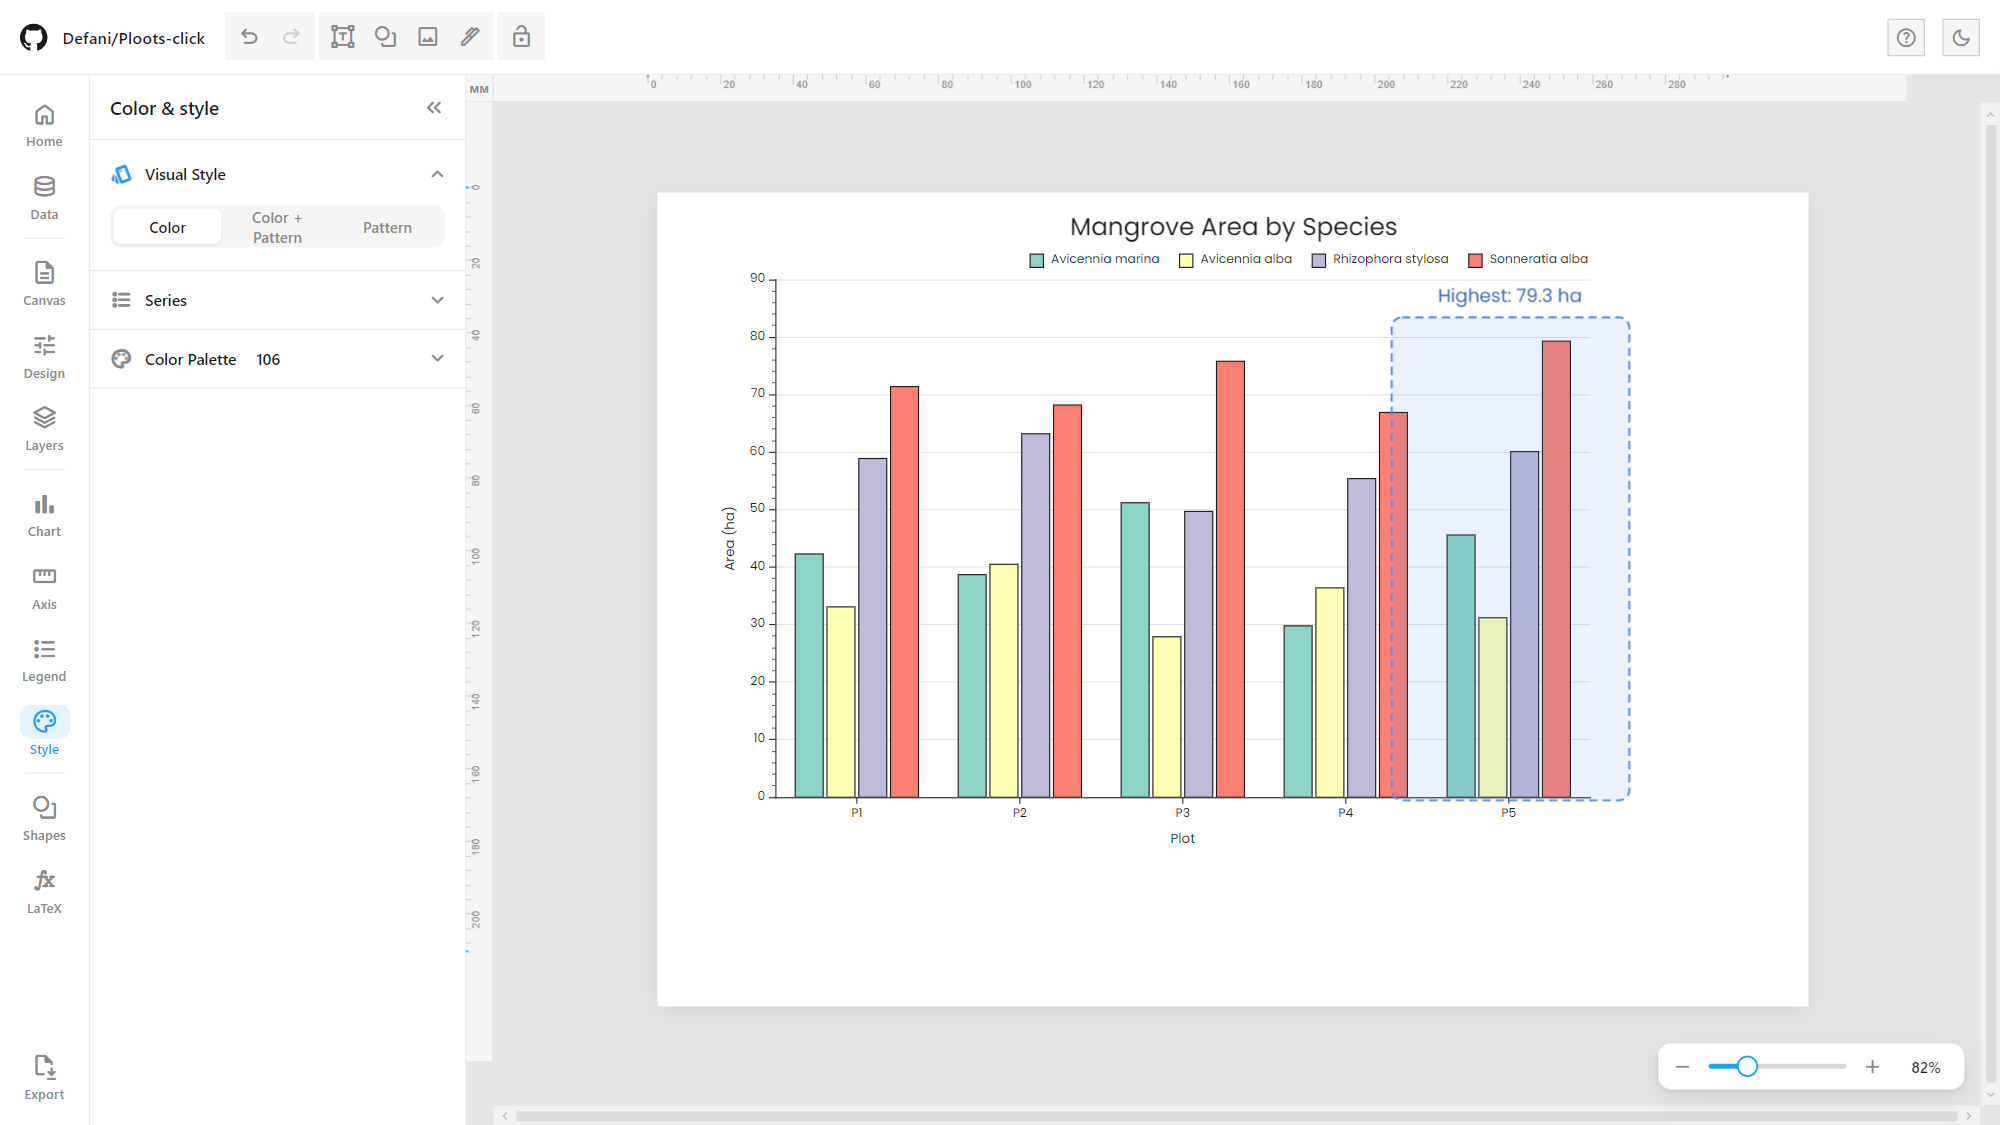 Color & style |
 Legend | 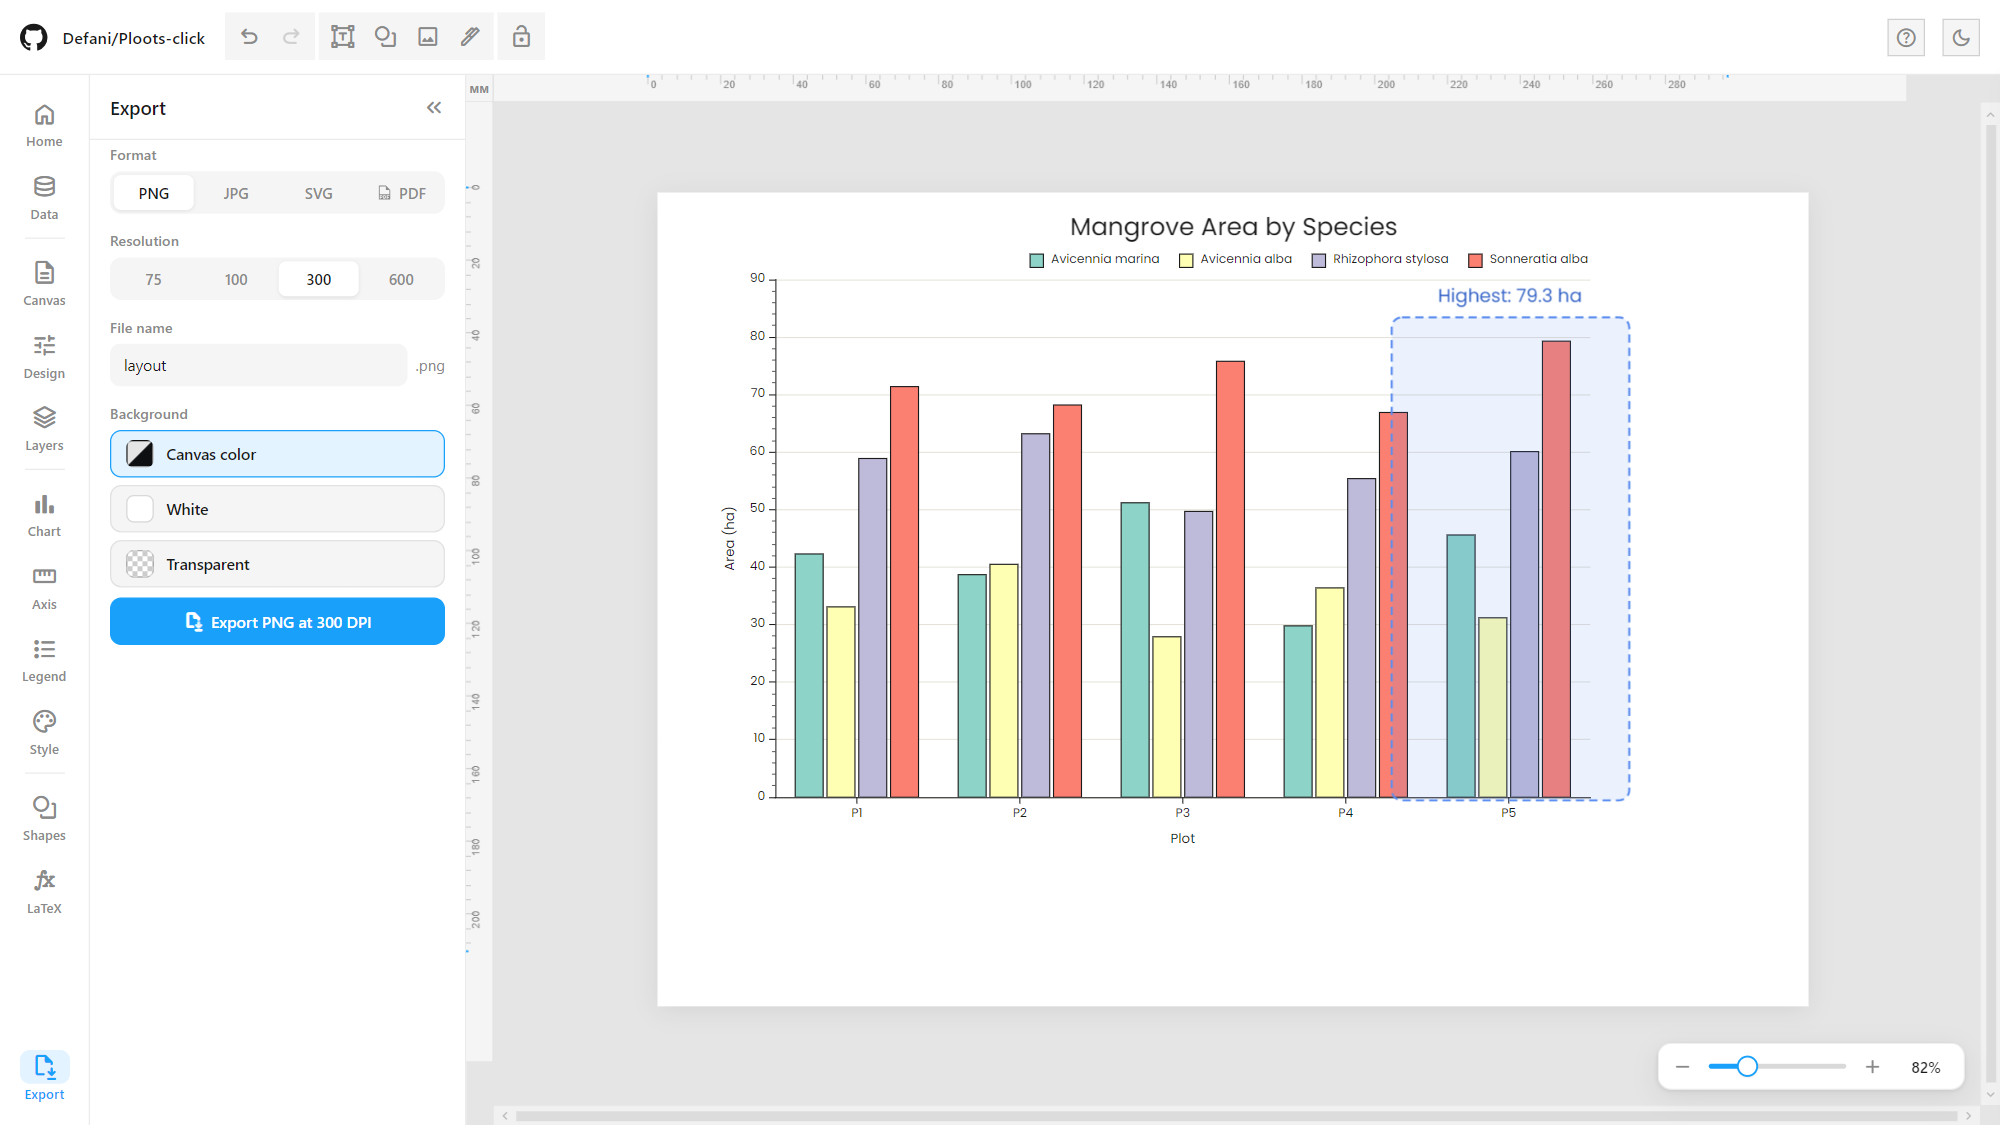 Export |
Map workspace (GIS)
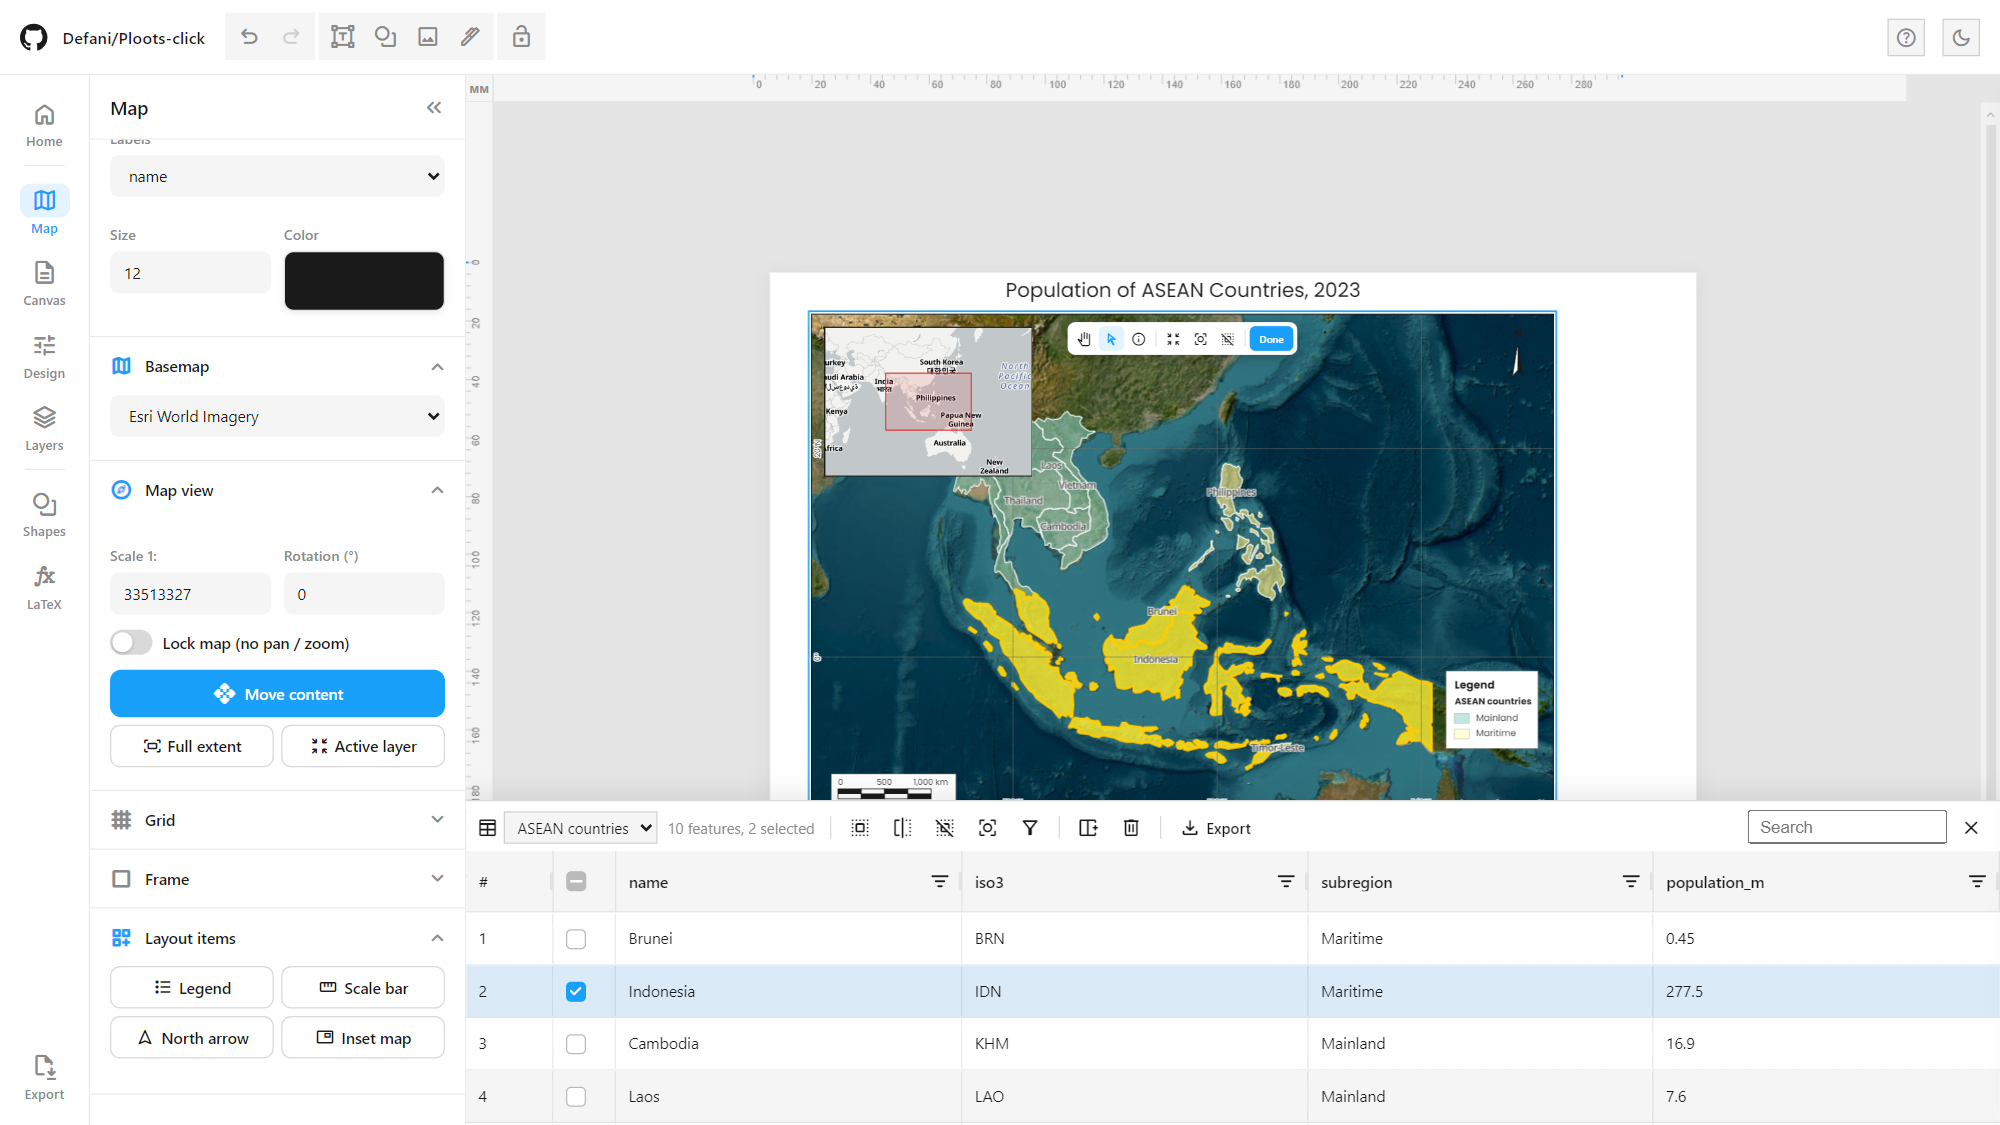
Pick Map on the Home screen (or the Map button in the rail) and the page’s chart block becomes a MapLibre GL map frame, driven by its own Map panel. It works like a small QGIS print layout:
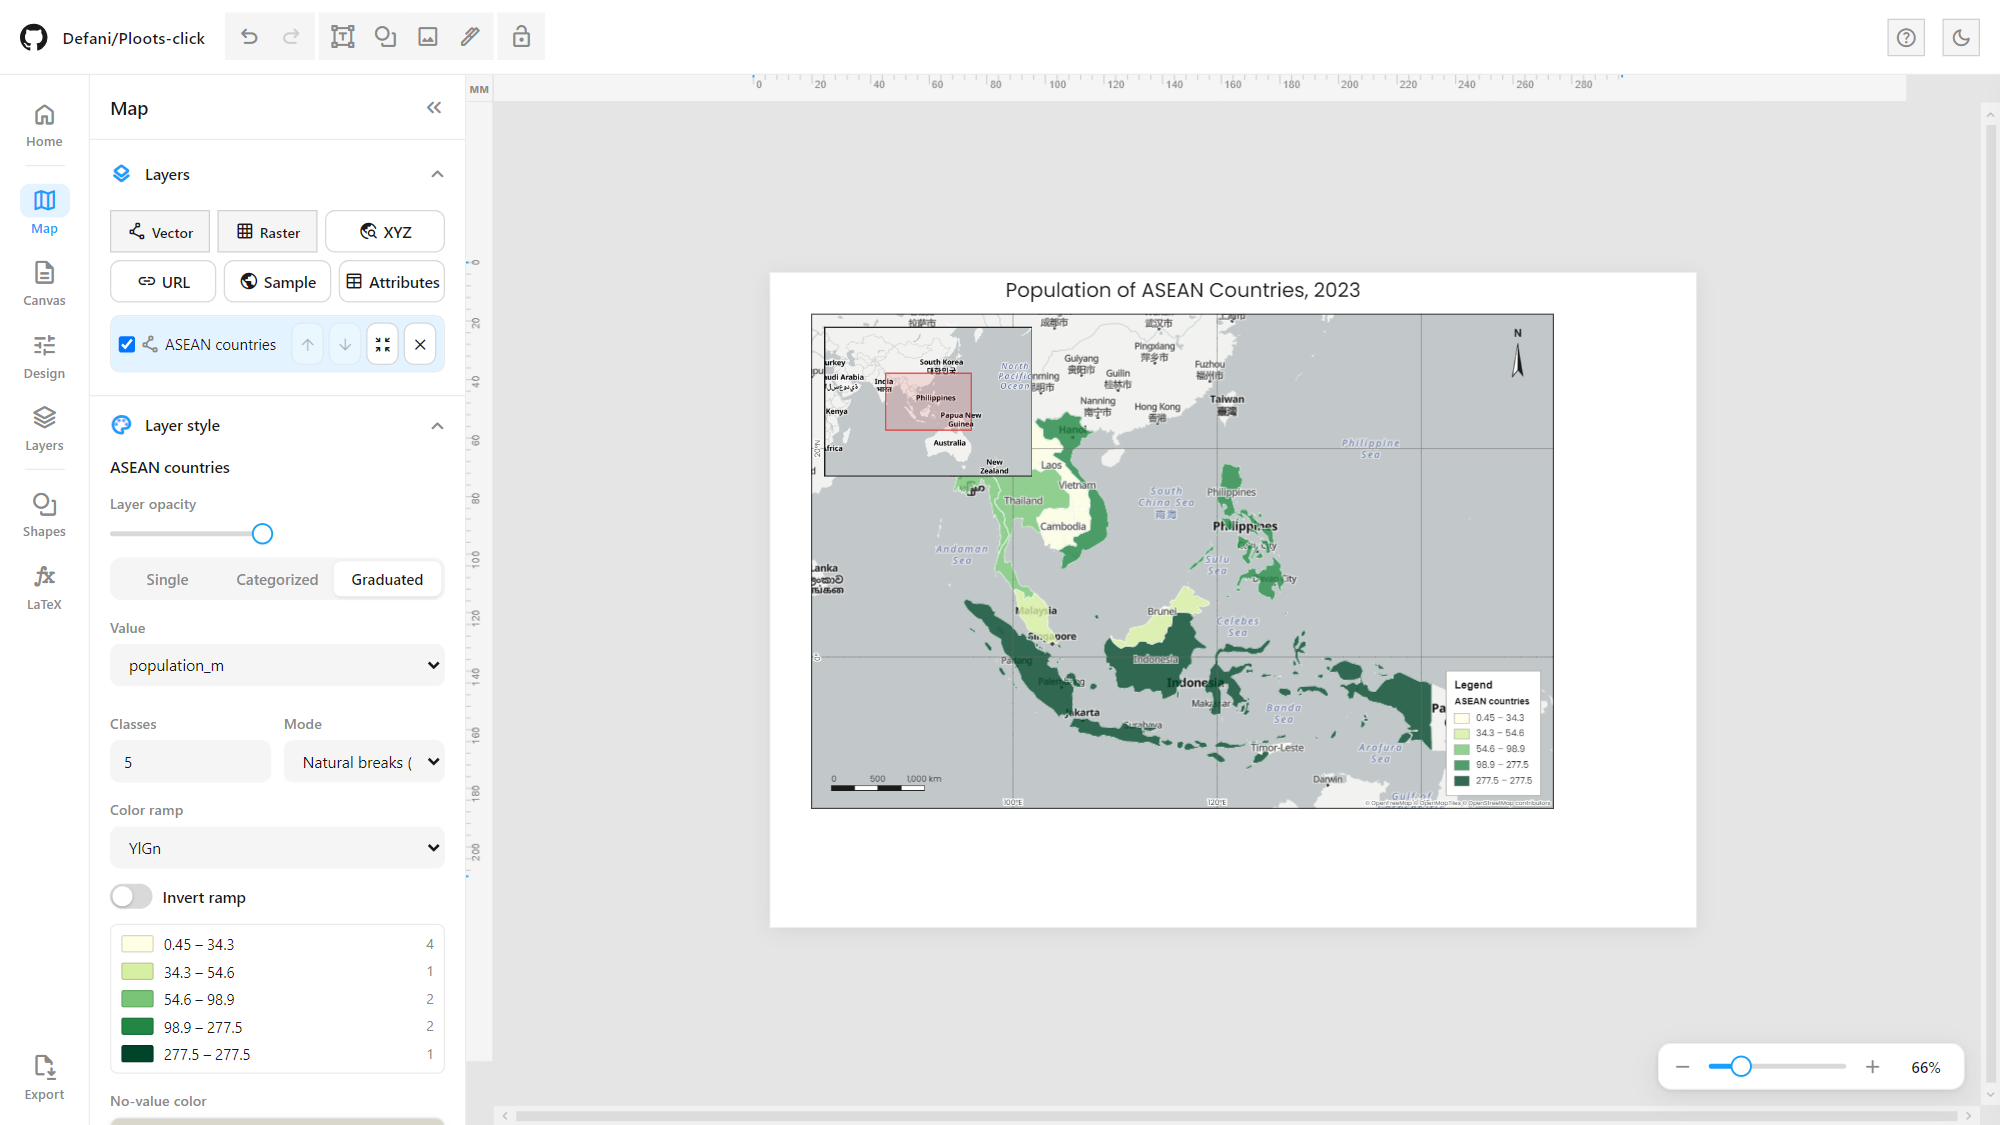
Layers: any number of vector layers (GeoJSON, TopoJSON, Shapefile, KML / KMZ or GPX from a file, a zipped shapefile, a URL or pasted text), raster layers (GeoTIFF: EPSG:4326, EPSG:3857 and WGS 84 / UTM zones; single-band on a color ramp, continuous or in discrete classes, or RGB) and XYZ tile layers. The layer list works like the QGIS layer tree: drag to reorder, hide, expand a layer to see its classes, and optional feature counts.
Layer menu (right-click a layer or its ⋮ button), as in QGIS and ArcGIS: zoom to layer or selection, open the attribute table, layer styling, filter (definition query), select by expression, select all / invert / clear, field calculator, show in legend, show feature count, show labels, rename, duplicate, move to top or bottom, export GeoJSON / selected features / CSV / Shapefile (.zip) / KML (keeps single and categorized colors) / GPX, properties and remove. Double-click a layer for its properties: name, legend name, attribution, source information (features, geometry, fields, CRS, extent), opacity and scale-dependent visibility (minimum and maximum 1:n).
Expressions (filter, select by expression, field calculator) use QGIS syntax, e.g.
"population" > 50 AND "subregion" = 'Maritime',name LIKE 'Ma%',iso3 IN ('IDN', 'MYS'),"area" IS NOT NULL,"pop" / "area" * 1000, with a field list, a value list and a live count of matching features.Symbology per layer, as in QGIS: Single symbol, Categorized (a color per value, each editable) and Graduated (natural breaks / Jenks, quantile or equal interval on a color ramp). Values come from a feature property or are joined from the Data table. Fill opacity, stroke, point size and line width, and solid, dashed, dotted or dash-dot outlines and lines. Vector tile layers get fill, outline, opacity, line width and style, and point size.
Renderers: plain features, proportional symbols (circle area or linear size by a numeric field, also at polygon centroids, with nested reference circles in the legend) or a heatmap (optional weight field, radius, intensity, color ramp).
Labels: a field or a template such as
{name} ({population_m} M), regular/bold/italic font, color, halo color and width, labels that follow lines (rivers, roads), and an option to show all labels even when they overlap.Basemaps (35, grouped): OpenFreeMap vector styles; imagery (Esri World Imagery, Sentinel-2 cloudless 2023/2024 by EOX, NASA VIIRS true color of the latest day, NASA Blue Marble); topographic (Esri Topo, Terrain, Shaded Relief, Physical, National Geographic, Ocean, OpenTopoMap); streets (OpenStreetMap, OSM Humanitarian, CyclOSM, CARTO Voyager, Esri Streets); light and dark canvases (CARTO, Esri); seven GBIF styles; or none.
Data catalog (Catalog in the rail, or Add layer → Data catalog), read live so the newest releases appear as soon as they are published:
Government ArcGIS servers: Kementerian Kehutanan (Planologi, formerly KLHK: forest areas, deforestation, burned areas…), BNPB (disaster data, including the current year) and BIG / Ina-Geoportal (RBI), plus any other ArcGIS REST server by URL. Browse folders and services, sort newest first, and add layers as map tiles or as features (with the attribute table and symbology).
Global Forest Watch: all 380+ datasets, searchable, each added at its latest version (raster datasets as tiles, vector datasets as vector tiles).
Species: GBIF occurrences and iNaturalist observations for a taxon (autocomplete, accepted names first) in the map view, a country or worldwide, with year range, record type or quality grade and a record limit; the fields useful for analysis are kept (dates, observer, accuracy, license, links). GBIF can also add its occurrence density map.
Map view: set the scale (1:n) and rotation directly, lock the map, or move the content inside the frame (double-click the map) with Pan, Select (click or drag a box), Identify and Measure (line length, or area and perimeter, on the sphere) tools, zoom in / out / full / to layer / to selection, and previous and next extent. The same tools are in the top bar’s Tools menu. The mouse wheel zooms the map while moving content.
Coordinate grid: geographic (degrees-minutes or decimal degrees) or UTM in meters or kilometers (zone from the map center or chosen), as lines or crosses, with labels inside or outside the frame (outside labels get their own margin and ticks, as in a QGIS map item), and a configurable map frame.
Layout items, free objects on the page that stay linked to the map: a legend built from the symbology (choose which layers and which classes it lists, whether hidden layers appear, and a legend name per layer), a scale bar (single box, double box, line ticks middle/down/up, stepped, hollow or numeric 1:n; units, segments, background frame), a north arrow (eight styles, follows the map rotation), an inset map that shows the main map’s extent, and a matplotlib-style color bar for a raster or graduated layer (continuous or discrete, square or pointed ends on both, min or max, horizontal or vertical, ticks and title). Move, resize and layer them like any shape; text, LaTeX and shapes from the usual tools sit alongside.
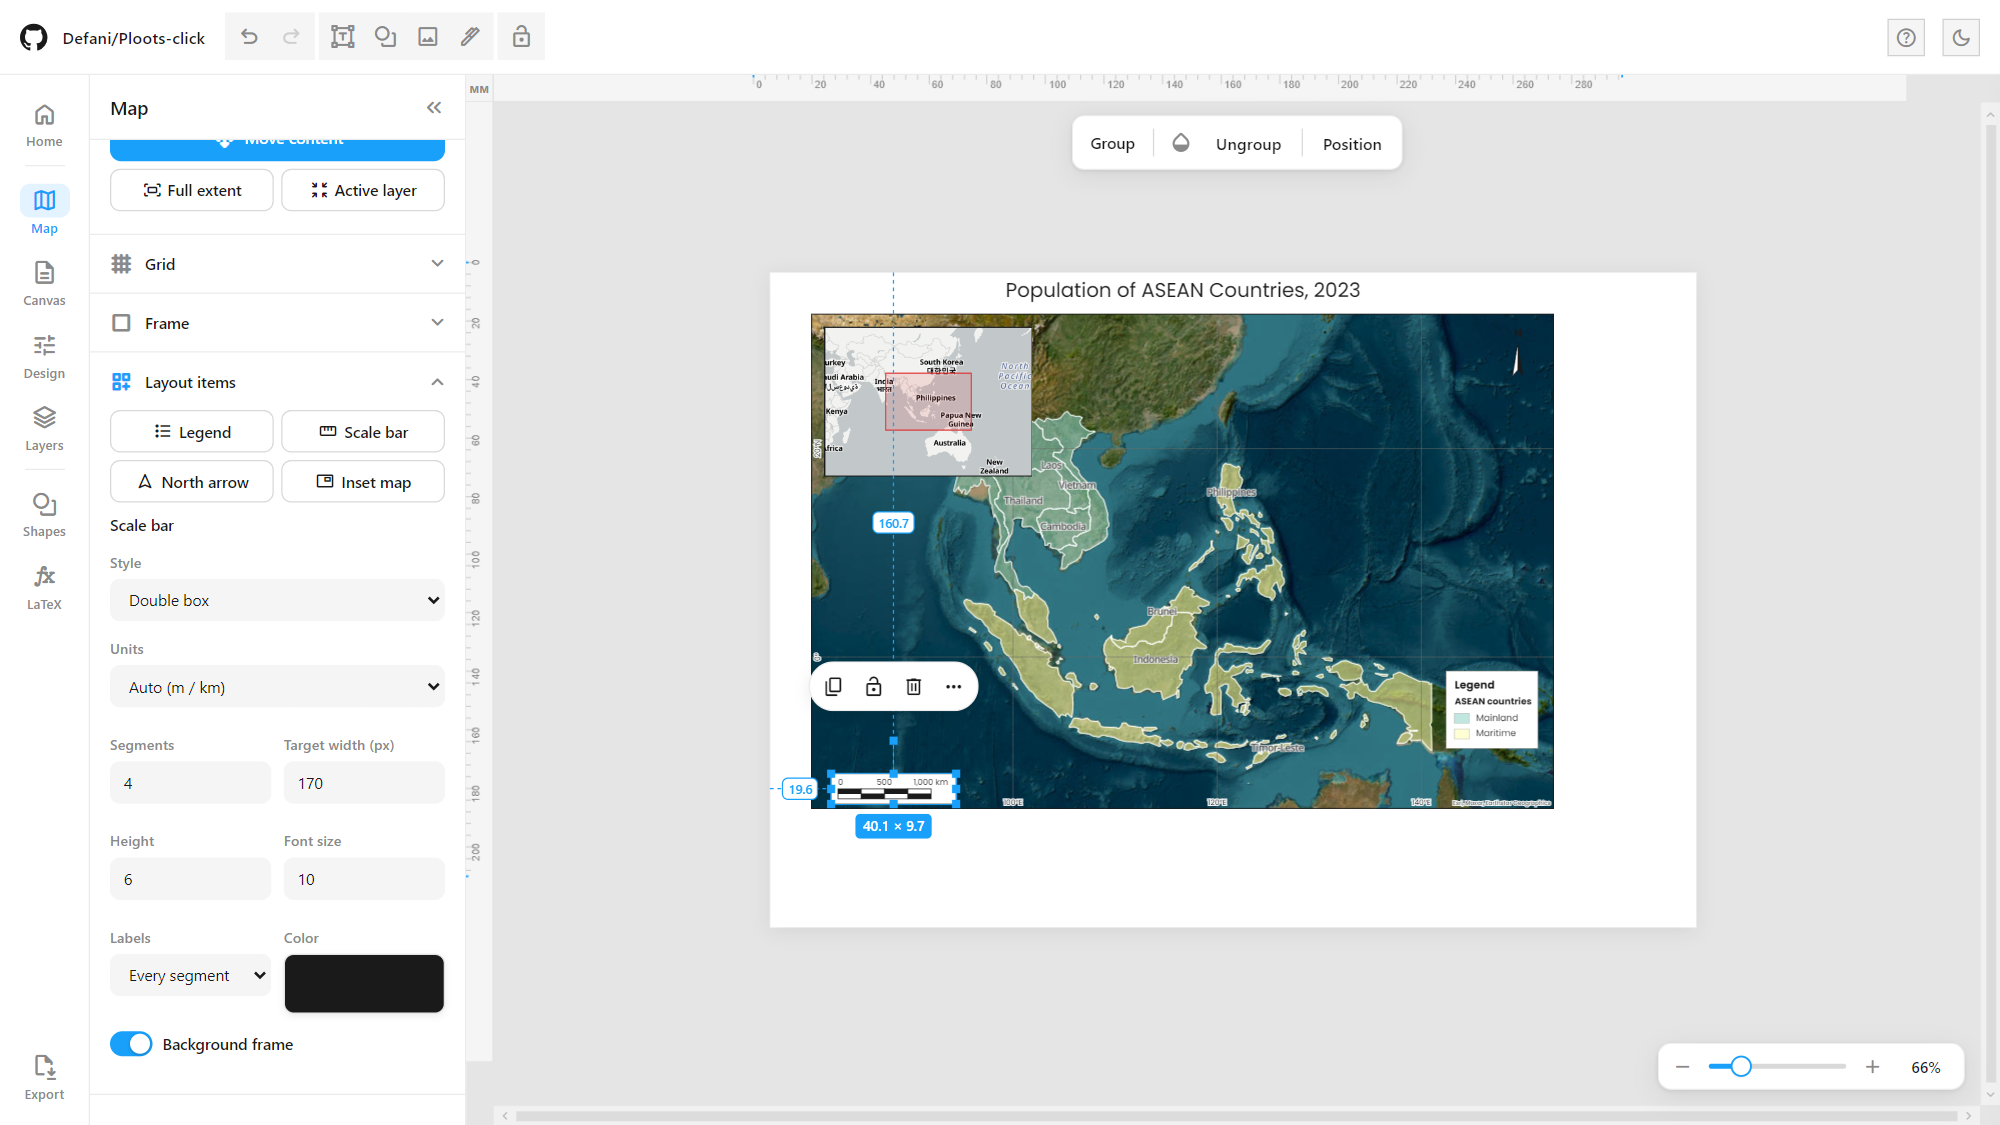
Attribute table (a dock under the map): view and edit values, select features (rows and map stay in sync, selections shown in yellow), show selected only, search, select by expression, add a field, the field calculator, delete features, and export GeoJSON, CSV, Shapefile (.zip), KML or GPX of all features or only the selected ones.
KoboToolbox monitoring
The Kobo button in the rail (map mode) connects to a KoboToolbox server (Global, EU, OCHA or your own) with your API token and lists your forms. Pick a form and open the monitoring dashboard:
Overview: submissions, today versus yesterday, enumerators active today, average per enumerator-day, area surveyed, quality flags and the last submission; a chart of submissions per day stacked by enumerator; an enumerator × day matrix that shows who submitted how much on each day, with today highlighted; today’s status per enumerator (active in the last hour, idle, or no submission yet); and a live feed where new submissions are highlighted.
Enumerators: submissions, today, active days, per day, median interview length, GPS coverage and median accuracy, distance walked, area, quality flags and last submission, plus the list of flagged submissions.
Recap: every question, with choice counts for select questions and statistics plus a histogram for numbers, and a per-village table.
Route: an animated route per enumerator for one day, on its own map. Play or pause, choose the speed, scrub the timeline, turn enumerators on and off, and watch a bubble pop up at each arrival. While the dashboard refreshes, new submissions animate in.
Data: the submissions table with search, CSV export and Add to map. Add to map creates a point layer colored by enumerator, with every answer as an attribute, ready for symbology, labels, the attribute table and the print layout. Routes can be added as a line layer too.
Filters for date range and enumerator apply to every tab. Auto refresh (every 1 to 30 minutes) fetches only new submissions and shows a notification with who sent them. Fields for enumerator, respondent, village, area, survey date and location are detected from common names and can be changed. Quality checks flag short interviews, missing GPS and poor GPS accuracy.
Why a proxy is needed. The KoboToolbox API does not allow requests from other websites (CORS), so a browser page cannot read it directly. Run the small proxy in tools/ on your computer; it only forwards read-only /api/v2/ requests to Kobo servers, listens on 127.0.0.1 only, and never stores your token:
python tools/kobo_proxy.pyAdd --allow-host kobo.example.org for a self-hosted server. Add --demo to also serve a generated demo form, “Coffee farmer baseline (demo)”: five enumerators near Takengon over the last ten days, with today’s submissions arriving through the day. The demo lets you try the dashboard without an account.
Chat with Claude
The round Claude button opens a chat bubble. It connects Ploots Click to the geolibre-live MCP server (the same server used by the GeoLibre Live MCP Bridge plugin) at ws://127.0.0.1:9878. With that server registered in Claude Desktop or Claude Code:
Messages typed in the bubble reach Claude through
live_chat_wait/live_chat_inbox(say “dengar geolibre” in Claude to start listening). Claude answers in the bubble withlive_say(a task list with progress, then a notification when done) andlive_show_chart(Plotly charts inside the chat).Claude reads the survey from the real submissions with
live_kobo_summary,live_kobo_fields,live_kobo_rows,live_kobo_aggregateandlive_kobo_load. It gets the same derived fields as the GeoLibre Kobo Connector (_enumerator,_desa,_tanggal,_submission_date,_luas_ha,_validasi), plus_durasi_menit.Claude can also read and drive the map:
live_get_state,live_list_layers,live_get_layer_features,live_get_selection,live_screenshot,live_set_view,live_zoom_to_layer,live_set_basemap,live_add_geojson_layer,live_add_tile_layer.
The server keeps one app connection and the newest one wins, so a GeoLibre window with the bridge plugin and Ploots Click take turns. If another app takes over, the bubble shows it and does not reconnect by itself. Connecting by hand turns on auto-connect for your next visit.
Files (folder browser)
Like the QGIS Browser panel: Files in the left rail connects one or more folders on your computer. They are remembered for the next session; the browser or the desktop app asks again for permission when needed. Browse them as a tree and filter by name, then double-click (or press Enter on) a file to open it:
CSV / TSV / TXT, Excel, JSON tables become chart data.
A CSV with latitude / longitude columns, opened in the map workspace, becomes a point layer. This works for Kobo or GPS exports, for example.
GeoJSON / TopoJSON become vector layers and GeoTIFF becomes a raster layer.
Shapefiles open as layers. Only the
.shpis listed, as in QGIS; its.dbf,.prjand.cpgare read with it. Coordinates are converted from UTM, any Transverse Mercator (e.g. DGN95 / Indonesia TM-3) or Web Mercator to WGS 84, and polygon holes are kept.KML / KMZ (Google Earth, Avenza, Kobo exports) open as layers, with names, descriptions, ExtendedData and folders as attributes.
GPX opens as waypoints, one line per track segment (with its length and start / end time) and routes.
A zipped shapefile / KML / GPX is added to the map.
Images are placed on the page.
A plugin .zip is installed.
Working with files:
Type filter: All, Tables, Vector, Raster or Images.
Several at once: Ctrl / Shift + click to select several files, then Open all.
Right-click for Open, Use as chart data, Add as points (tables with latitude / longitude), Add to map, Copy name and Copy path.
Drag files onto the page or the map to open them; images land where they are dropped.
Watches expanded folders while the app is visible. New files (a fresh Kobo export, GPS tracks just copied in) get a green dot and a notification.
Recent lists the last files opened, above the folders.
Save exports to a connected folder, or Ask each time, instead of Downloads. This covers every export: PNG / JPG / PDF / SVG, CSV and GeoJSON, Kobo CSV and plugin zips. Name clashes get " (2)", and the folder asks once for write access.
Selecting a file shows a preview before it is opened: the first rows of a CSV or Excel sheet (with the list of sheets), a thumbnail map of a vector file with its feature count, geometry type and fields, an image thumbnail, or a plugin’s name and description. Expanded folders are remembered.
Files are read from disk when opened; nothing is copied or uploaded. This uses the File System Access API (Chrome, Edge and the desktop app). In other browsers, a folder can be read for the current session only.
When the app opens, an intro says “Welcome to Ploots Click”: personal GIS, data analysis, visualization and field monitoring, a private tool of Defani Arman Alfitriansyah, for personal use only and not for distribution.
Sign-in. The intro also asks for a username and password.
First launch: you set up the account.
Every launch after that: you sign in, and the app stays covered until then.
Nothing runs before sign-in. Plugins, the Claude bridge and the Kobo auto-reopen wait until you are signed in. The bridge also disconnects while the app is locked.
How the password is kept: only a PBKDF2-SHA-256 hash (310,000 iterations, random salt) is kept on the device.
Wrong attempts: after three, each new attempt must wait longer.
Locking again: the lock button in the top bar locks the app; About → Account changes the username or password and sets auto-lock after 5 to 60 minutes of inactivity.
Forgotten password: it can only be reset, and resetting also removes what the app saved on that device. Files on disk are not touched.
This lock protects the app on a device. It is not encryption: someone with the app’s files and the know-how can get past it. To keep the software itself private, keep the repository private and turn GitHub Pages off.
Plugins
Add features without changing the app, the same way as GeoLibre plugins. Plugins in the left rail installs a plugin from a .zip, a folder or a plugin.json URL (a .zip can also be dropped on the panel). Each installed plugin can be enabled, disabled, reloaded, downloaded as a .zip or removed. Installed plugins are kept in the browser (or the desktop app) and load at startup.
A plugin is a folder with a plugin.json manifest and one ES module that exports activate(app) / deactivate(app). Through app, a plugin can:
add top-bar buttons, rail panels, dialogs and notifications;
read and change map layers, the view and the basemap;
read and set chart data and the chart type;
add text and images to the page;
keep its own settings;
read the KoboToolbox data;
send messages to the Claude chat.
Everything a plugin adds is removed when it is disabled. New plugin downloads a working starter to edit. The API is documented in PLUGINS.md, and an example plugin is in plugins/examples/map-coordinates/ (cursor coordinates in decimal degrees, DMS or UTM).
Page layout & annotation
Full-page canvas, separate from the chart block: position and resize the chart anywhere on the page.
10 built-in page templates (A4/Letter/Legal landscape & portrait, 16:9 and 4:3 presentation, Instagram Story, social square) plus custom width/height in px, mm or cm, and a page background colour.
Zoom with the mouse wheel (around the pointer), the slider at the bottom right, or Ctrl + and Ctrl − (Ctrl 0 for 100%). Shift + wheel pans sideways; custom pan scrollbars.
Drafting-style rulers on the canvas edges, unit- and zoom-aware, that also act as a source for draggable guide lines.
Layout objects on top of the chart (Fabric.js): text boxes, 30 shapes, images and a vector Pen tool (click for corners, drag for curves, click the first point to close), with lock, duplicate, delete, grouping and a right-click menu.
LaTeX & symbol tool: type formulas in
$...$and see them rendered live on the canvas with MathJax (e.g.$R^2 = 0.95$,$CO_2$), with colour, size and font controls, recent formulas, ready-made templates, and a searchable symbol/unit catalog that also works in axis labels.Undo/redo for chart settings and canvas objects alike, and a help search (question-mark icon) that finds any menu or setting by name.
Export
PNG, JPG, SVG or PDF from the Export panel, at 75, 100, 300 or 600 DPI.
PNG/JPG/PDF are a full-page composite of the background, the chart and every layout object, exactly as shown in the editor. PDF can be vector (via svg2pdf) or flattened.
Background: follow the canvas colour, force white, or transparent (PNG).
Zero install: D3.js is bundled locally; everything else loads from a CDN only when a feature first needs it. No build step, no server, no signup.
Architecture
Everything below happens in a single browser tab — there’s no backend, no build step, and no network call other than fetching static assets (libraries from a CDN on first use, base maps from this repo).
High-level data flow, from raw input to exported file:
GitHub renders Mermaid with raw HTML/
<img>stripped from node labels, so logos can’t sit inside the boxes above — this legend maps each engine to its stage instead:
| Stage | Engine |
|---|---|
| CSV/TSV parsing |  |
| Excel import |  |
| Chart rendering |  |
| Layout canvas / shapes / text |  |
| LaTeX formulas on canvas |  |
Data View: wide ↔ long/tidy and field mapping, the step between raw parsed rows and the chart’s series:
Project structure
.
├── index.html                     # App shell, styling, <script>/<link> tags, splash screen
├── sw.js                          # Service worker (network-first cache, so the app also opens offline)
├── manifest.json                  # Web app manifest (installable PWA)
├── js/
│   ├── lazy-loader.js             # Loads CDN libraries on first use (Fabric, Papa Parse, SheetJS, AG Grid, jsPDF, ...)
│   ├── desktop-shell.js           # Desktop app only: opens web links in the default browser
│   ├── plugins.js                 # Plugin manager: install (.zip / folder / URL), enable, the app API, starter
│   ├── file-browser.js            # Files panel: connected folders, tree, open files by type
│   ├── formats.js                 # Shapefile (+ .prj reprojection), KML / KMZ and GPX readers
│   ├── intro.js                   # Launch intro, sign-in / account setup, About and Account dialogs
│   ├── lock.js                    # Password lock: PBKDF2 hash, attempt delays, Lock button, auto-lock, reset
│   ├── chart-builder/             # Chart settings, data and export, in numbered load-order files
│   │   ├── 01-config.js           #   static config: fonts, canvas templates, hatch/dash/marker defs
│   │   ├── 02-state.js            #   shared state object, chart type list, sample data per chart type
│   │   ├── 03-ui-lists.js         #   populates font/template/unit pickers in the sidebar
│   │   ├── 04-data.js             #   parses pasted/imported data into series, series list UI
│   │   ├── 05-style-helpers.js    #   colour/pattern modes, value formatting, error bars
│   │   ├── 06-canvas-units.js     #   canvas size <-> unit conversion
│   │   ├── 07-render.js           #   legacy render() entry point; js/d3-engine/ wraps it and draws every chart
│   │   ├── 08-helpers-export.js   #   string/colour helpers, multi-format export panel (PNG/JPG/SVG/PDF)
│   │   ├── 09-event-wiring.js     #   wires sidebar controls (style, axes, legend, ranges, export)
│   │   ├── 10-view-switcher-init.js # Layout/Data view switcher, boots the chart on load
│   │   ├── 11-choropleth.js       #   choropleth settings (state defaults + "Peta (Choropleth)" sidebar panel)
│   │   ├── 12-radial-rings.js     #   Radial Rings registration + its SVG renderer
│   │   ├── 13-lollipop.js … 20-dumbbell.js # chart type registration + sample data (lollipop, bubble,
│   │   │                          #   sunburst, ridge plot, sankey, scatter matrix, bubble map, dumbbell)
│   ├── d3-engine/                 # The chart engine (see D3-MIGRATION.md)
│   │   ├── 00-core.js             #   PlootsD3 namespace, renderer registry, rich text, patterns, mount
│   │   ├── 01-frame.js            #   shared cartesian frame: scales, axes, ticks, gridlines, titles, legend
│   │   ├── 02-cartesian.js        #   bar (single/grouped/stacked), line, area, scatter
│   │   ├── 03-stats.js            #   pie, donut, histogram, box, violin, heatmap
│   │   ├── 04-flow.js             #   waterfall, funnel, treemap
│   │   ├── 05-special.js          #   lollipop, dumbbell, bubble, scatter matrix, sankey, ridge plot, radial rings, sunburst
│   │   ├── 06-geo.js              #   choropleth and bubble map (d3-geo, local topojson)
│   │   ├── geo-country-regex.js   #   country name -> ISO-3 matching
│   │   └── 99-integration.js      #   hooks the engine into render(), export and the Format Axis panel
│   ├── layout-editor/             # Fabric.js full-page canvas and editor UI, in numbered files
│   │   ├── 01-canvas-core.js      #   canvas setup, chart-proxy sync, stage resize
│   │   ├── 02-toolbar-text.js     #   main toolbar wiring, "Add text" tool
│   │   ├── 03-shapes.js           #   shape picker and the 30 shape geometries
│   │   ├── 04-images.js           #   "Add image" tool
│   │   ├── 05-object-actions.js   #   lock/unlock, duplicate, delete
│   │   ├── 06-context-menu.js     #   right-click menu
│   │   ├── 07-selection.js        #   selection events, which format bar to show
│   │   ├── 08-format-bars.js      #   format bars (text/shape/image/formula) wired to the active object
│   │   ├── 09-panels-helpers.js   #   colour-swatch helpers, side-panel sync
│   │   ├── 10-export-overlay.js   #   flattens all Fabric objects to a transparent PNG for export
│   │   ├── 11-sidebar-nav.js      #   left sidebar panel switching
│   │   ├── 12-theme-init.js       #   dark/light theme, final boot calls
│   │   ├── 13-axis-title-detach.js #  detach X/Y axis titles into free text
│   │   ├── 14-legend-hover.js     #   drag the chart legend on the canvas
│   │   ├── 15-legend-detach.js    #   detach the legend into a free-floating group
│   │   ├── 16-draw-tool.js        #   Pen tool: vector paths with corner and curve anchors
│   │   ├── 17-textbox-resize.js   #   text boxes resize their width instead of stretching the text
│   │   ├── 18-chart-quickbar.js   #   floating quick controls when the chart is selected
│   │   ├── 19-axis-tick-float.js  #   "Axis Tick Line" block in the Axis tab
│   │   ├── 20-canvas-zoom.js      #   zoom slider, Ctrl +/−/0 and Ctrl+wheel zoom
│   │   ├── 21-layers-panel.js     #   Layers tab (reorder, rename, hide, lock, group)
│   │   ├── 22-axis-format-panel.js #  click an axis to open its Format Axis panel
│   │   ├── 23-canvas-pan-scrollbars.js # themed pan scrollbars
│   │   ├── 24-text-float-bar.js   #   Canva-style floating format bars above the canvas
│   │   ├── 25-design-panel.js     #   Figma-style Design tab (position, size, fill/gradient, stroke, shadow)
│   │   ├── 26-selection-hud.js    #   W × H badge and distance guides for the selection
│   │   ├── 27-object-float-bar.js #   floating bars for shapes, images, formulas, groups
│   │   ├── 28-axis-controls-sync.js # keeps the Axis tab's controls and the Format Axis panel in sync
│   │   └── 29-sidebar-design.js   #   Design and Layers as left-sidebar panels; groups the rail per mode
│   ├── gis/                       # Map workspace (MapLibre GL)
│   │   ├── 00-store.js            #   layers (vector / raster / XYZ), selection, export GeoJSON/CSV
│   │   ├── 01-symbology.js        #   single / categorized / graduated (Jenks, quantile, equal)
│   │   ├── 02-map.js              #   the map frame: basemaps, layers, grid, frame, scale, rotation, tools
│   │   ├── 03-items.js            #   legend, scale bar, north arrow, inset map as page items
│   │   ├── 04-raster.js           #   GeoTIFF reading and rendering (geotiff.js)
│   │   ├── 05-attribute-table.js  #   attribute table dock
│   │   ├── 06-panel.js            #   the Map panel
│   │   ├── 07-home.js             #   Home screen
│   │   ├── 08-catalog.js          #   data catalog: government ArcGIS, GFW, GBIF, iNaturalist
│   │   ├── 09-layer-menu.js       #   layer menu, filter / select by expression, field calculator, properties
│   │   ├── 10-bridge.js           #   Claude bridge (geolibre-live MCP over WebSocket) and chat bubble
│   │   └── 11-kobo.js             #   KoboToolbox connector, monitoring dashboard, route animation, data API
│   ├── data_view.js               # Data View: AG Grid table, wide/long reshape, transpose
│   ├── dv_shelves.js              # Data View chart-mapping shelves (drag fields onto X / Y)
│   ├── data_formulas.js           # Data View spreadsheet formulas (=SUM, =AVERAGE, ...)
│   ├── data_stats.js              # Data View column statistics (plain JS)
│   ├── color_picker.js            # Colour picker: solid/gradient, HSV, eyedropper, swatches
│   ├── palettes.js                # Built-in palette catalog, grid and search
│   ├── canvas_background.js       # Page background colour
│   ├── canvas_ruler.js            # Rulers on the canvas edges + draggable guide lines
│   ├── latex_symbols.js           # LaTeX (MathJax) formulas on canvas + the symbol/unit catalog
│   ├── help_search.js             # Help search: find a menu or setting by name
│   ├── ui_sections.js             # Collapsible sidebar sections
│   └── undo_redo.js               # Global undo/redo history
├── PLUGINS.md                     # How to write a plugin, and the app API
├── plugins/examples/              # Example plugin (map-coordinates)
├── tools/
│   └── kobo_proxy.py              # Local KoboToolbox API proxy (CORS) with an optional demo form
├── desktop/                       # Windows desktop app (Tauri 2)
│   ├── build_dist.py              #   offline copy of the web app into desktop/dist (libraries, fonts, icons local)
│   ├── make_icons.py              #   app icons from the logo
│   └── src-tauri/                 #   Rust shell: window, installers, native Kobo requests (kobo_get)
├── vendor/
│   ├── d3-7.9.0.min.js            # D3.js 7.9.0, bundled locally
│   └── topojson/                  # Natural Earth base maps (*_110m.json) for the map chart types
├── assets/
│   ├── logo_light.png, logo_dark.png # Topbar logo marks
│   ├── palettes.png               # Palette catalog image (used in this README)
│   └── screenshots/               # README screenshots; charts/ holds one image per chart type
├── D3-MIGRATION.md                # How the Plotly -> D3 migration was done, stage by stage
├── BUGFIXES.md                    # Notes on notable bug fixes
├── LICENSE                        # MIT license
├── THIRD-PARTY-NOTICES.md         # Notices for bundled D3.js, country-regex and the topojson base maps
└── README.md
LaTeX & Symbol Catalog
The formula box ($...$) is rendered live via MathJax, so any valid LaTeX math syntax works there, not just what’s listed below. The 104-symbol catalog is a curated, one-click subset for the symbols and units that come up most often in scientific figures — searchable by name or LaTeX code, and insertable directly onto the canvas without typing.
Greek (34)
| Symbol | Name | LaTeX |
|---|---|---|
| α | alpha | \alpha |
| β | beta | \beta |
| γ | gamma | \gamma |
| δ | delta | \delta |
| ε | epsilon | \epsilon |
| ζ | zeta | \zeta |
| η | eta | \eta |
| θ | theta | \theta |
| ι | iota | \iota |
| κ | kappa | \kappa |
| λ | lambda | \lambda |
| μ | mu | \mu |
| ν | nu | \nu |
| ξ | xi | \xi |
| π | pi | \pi |
| ρ | rho | \rho |
| σ | sigma | \sigma |
| τ | tau | \tau |
| υ | upsilon | \upsilon |
| φ | phi | \phi |
| χ | chi | \chi |
| ψ | psi | \psi |
| ω | omega | \omega |
| Γ | Gamma | \Gamma |
| Δ | Delta | \Delta |
| Θ | Theta | \Theta |
| Λ | Lambda | \Lambda |
| Ξ | Xi | \Xi |
| Π | Pi | \Pi |
| Σ | Sigma | \Sigma |
| Υ | Upsilon | \Upsilon |
| Φ | Phi | \Phi |
| Ψ | Psi | \Psi |
| Ω | Omega | \Omega |
Operators (26)
| Symbol | Name | LaTeX |
|---|---|---|
| ± | plus-minus | \pm |
| ∓ | minus-plus | \mp |
| × | times | \times |
| ÷ | divide | \div |
| · | dot product | \cdot |
| √ | square root | \sqrt{} |
| ∑ | summation | \sum_{i=1}^{n} |
| ∏ | product | \prod_{i=1}^{n} |
| ∫ | integral | \int_{}^{} |
| ∮ | contour integral | \oint |
| ∂ | partial derivative | \partial |
| ∇ | nabla | \nabla |
| ∞ | infinity | \infty |
| ≈ | approximately | \approx |
| ≠ | not equal | \neq |
| ≤ | less or equal | \leq |
| ≥ | greater or equal | \geq |
| ≡ | equivalent | \equiv |
| ∝ | proportional to | \propto |
| ∼ | similar to | \sim |
| ≅ | congruent to | \cong |
| ⊥ | perpendicular | \perp |
| ∥ | parallel | \parallel |
| ∠ | angle | \angle |
| ° | degree | ^{\circ} |
| ′ | prime | \prime |
Units (21)
| Symbol | Name | LaTeX |
|---|---|---|
| m² | square metre | m^{2} |
| m⁻² | per square metre | m^{-2} |
| km² | square kilometre | km^{2} |
| cm³ | cubic centimetre | cm^{3} |
| ha⁻¹ | per hectare | ha^{-1} |
| Mg ha⁻¹ | megagram per hectare | Mg\,ha^{-1} |
| g C m⁻² | grams carbon per m² | g\,C\,m^{-2} |
| g cm⁻³ | density | g\,cm^{-3} |
| kg m⁻³ | kg per m³ | kg\,m^{-3} |
| W·m⁻²·sr⁻¹·µm⁻¹ | spectral radiance | W\,m^{-2}\,sr^{-1}\,\mu m^{-1} |
| µm | micrometre | \mu m |
| nm | nanometre | nm |
| °C | degrees Celsius | ^{\circ}C |
| % | percent | \% |
| ‰ | per mille | \u2030 |
| R² | coefficient of determination | R^{2} |
| p<.05 | p-value | p < 0.05 |
| n= | sample size | n = |
| x̄ | sample mean | \bar{x} |
| σ | standard deviation | \sigma |
| ×10ⁿ | scientific notation | \times 10^{n} |
Arrows (8)
| Symbol | Name | LaTeX |
|---|---|---|
| → | right arrow | \rightarrow |
| ← | left arrow | \leftarrow |
| ↔ | left-right arrow | \leftrightarrow |
| ⇒ | implies | \Rightarrow |
| ⇔ | if and only if | \Leftrightarrow |
| ↑ | up arrow | \uparrow |
| ↓ | down arrow | \downarrow |
| ↦ | maps to | \mapsto |
Sets & Logic (15)
| Symbol | Name | LaTeX |
|---|---|---|
| ∈ | element of | \in |
| ∉ | not an element of | \notin |
| ⊂ | subset | \subset |
| ⊆ | subset or equal | \subseteq |
| ∪ | union | \cup |
| ∩ | intersection | \cap |
| ∀ | for all | \forall |
| ∃ | there exists | \exists |
| ¬ | not | \neg |
| ∧ | and | \wedge |
| ∨ | or | \vee |
| ∅ | empty set | \emptyset |
| ℝ | real numbers | \mathbb{R} |
| ℕ | natural numbers | \mathbb{N} |
| ℤ | integers | \mathbb{Z} |
Quick-insert structure templates (fraction, superscript, subscript, roots, summation/product/integral with bounds, limit, vector, overline, hat, binomial coefficient, 2×2 matrix) splice their LaTeX skeleton in at the cursor with the caret already placed where you’d start typing.
Color Palettes — sources & licensing
106 built-in palettes: the original 49, 50 more (the rest of the
ColorBrewer diverging/sequential families, common Matplotlib scientific
colormaps, and the Okabe-Ito colorblind-safe set) and 7 extra custom sets.
All colors are hard-coded hex arrays baked into palettes.js — no palette
library is bundled or loaded at runtime.
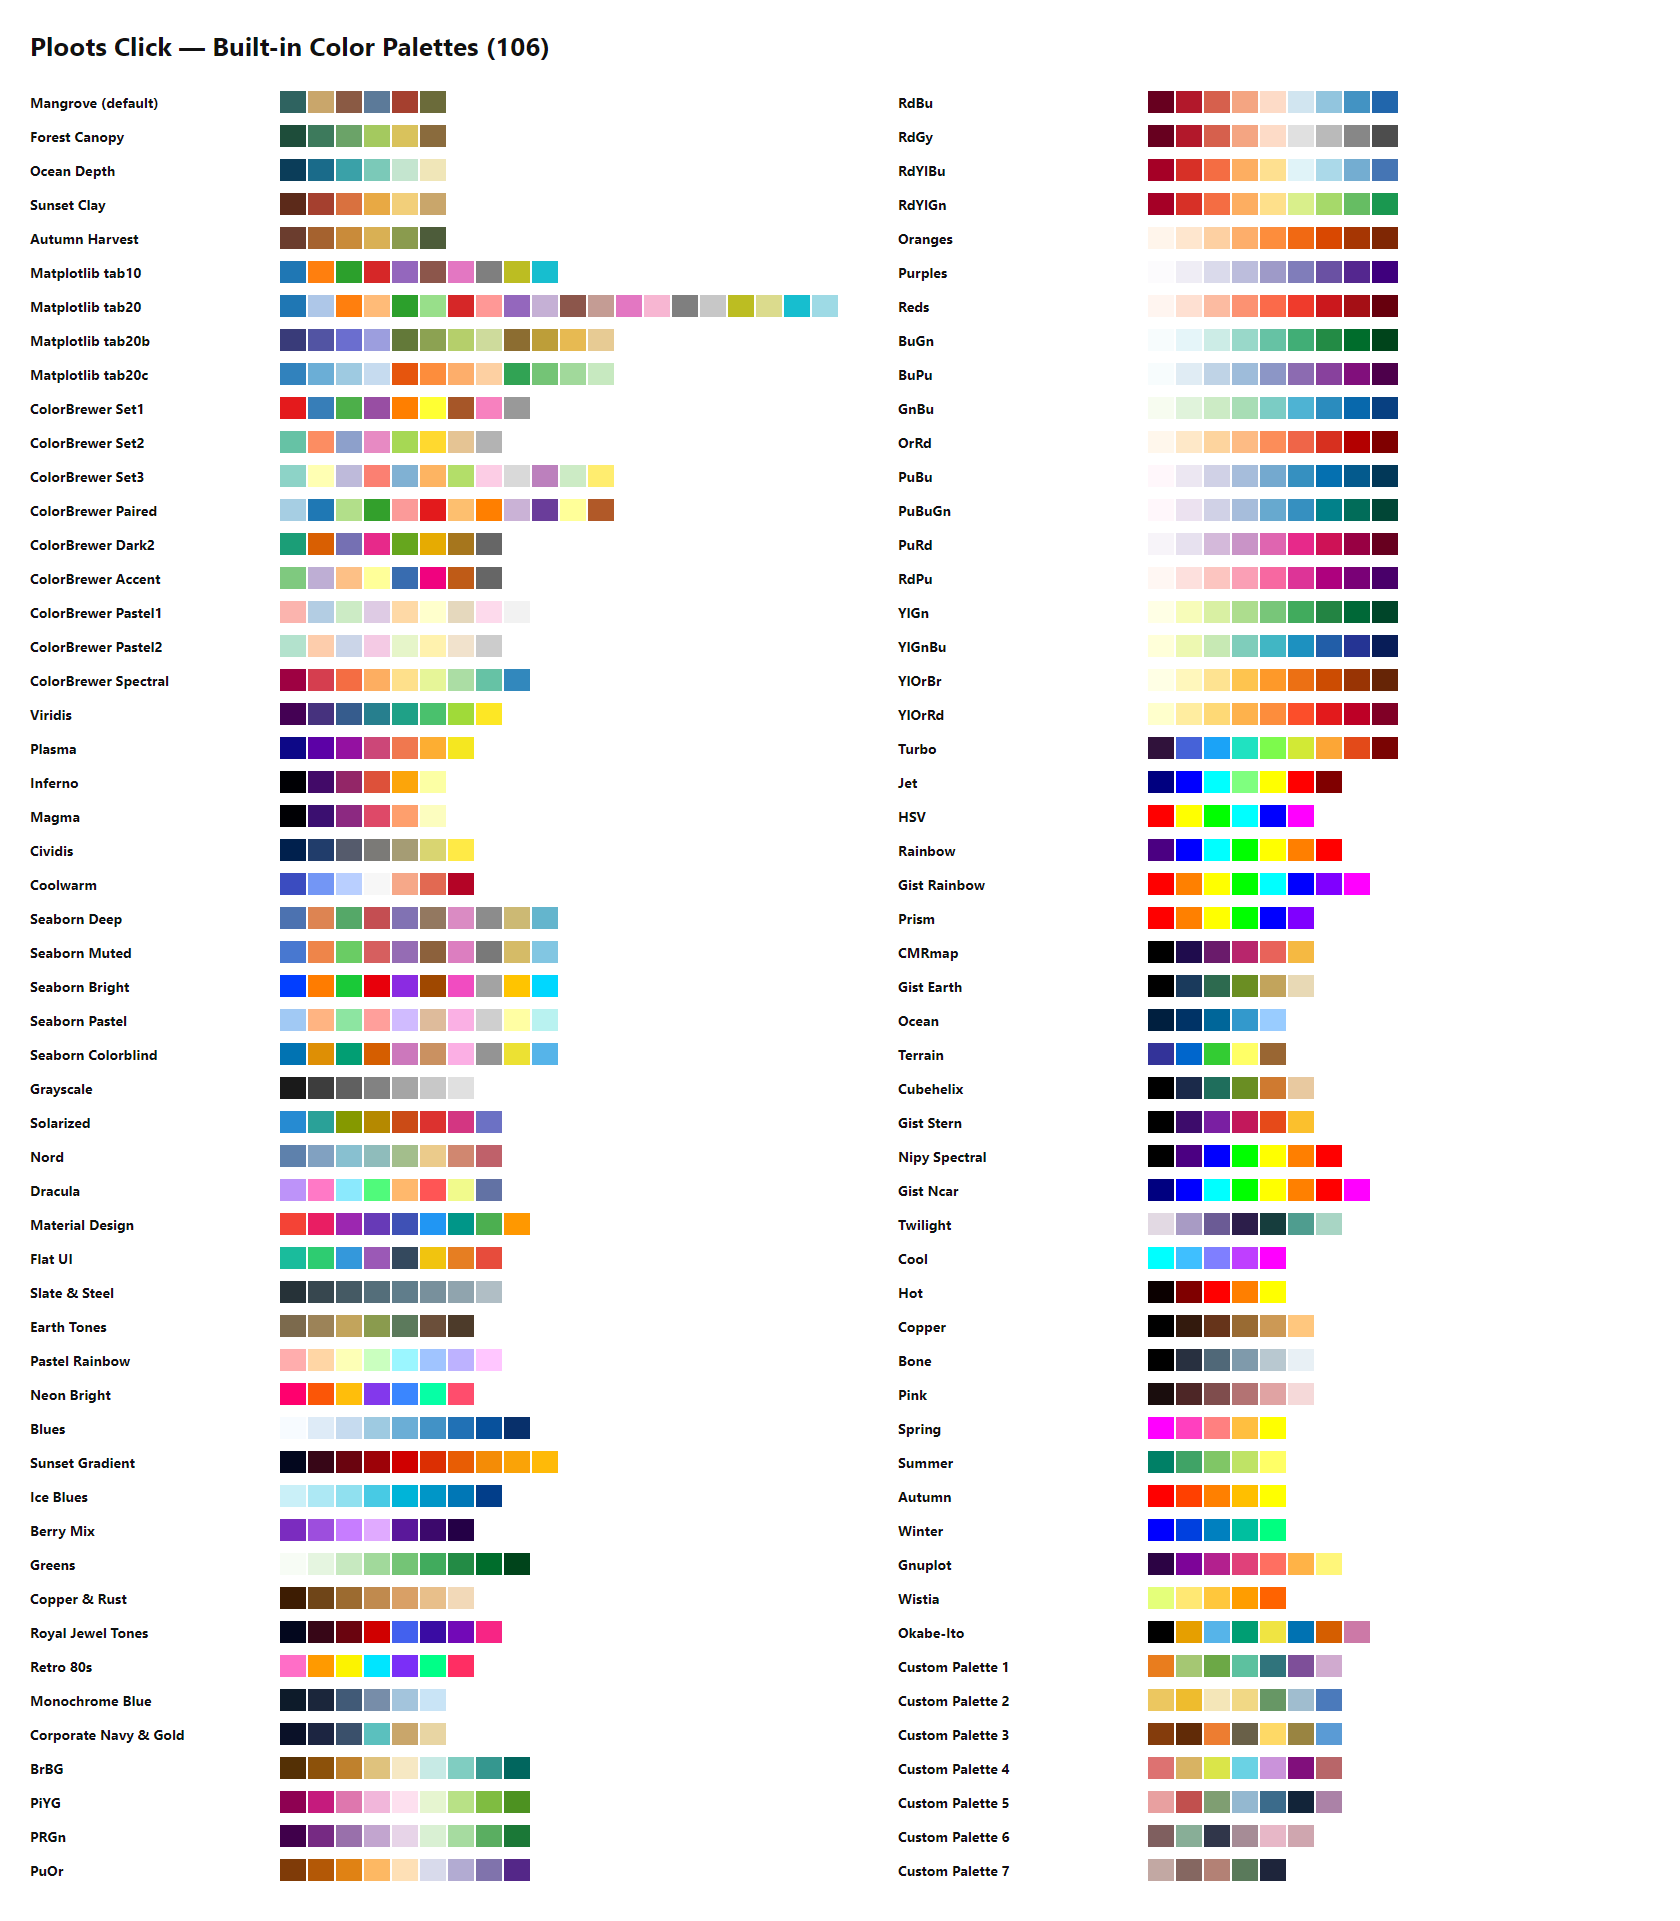
Two names from the original 49 were corrected to match their real source values so the catalog doesn’t carry two different names for the same standard scale: “Ocean Blues” → Blues and “Forest Greens” → Greens (both ColorBrewer sequential palettes, recolored to the actual ColorBrewer hex values in the process).
| Palettes | Inspired by / source | License |
|---|---|---|
| Matplotlib tab10, tab20, tab20b, tab20c | Matplotlib default qualitative color cycles | Matplotlib license (BSD-style, PSF-based) |
| Viridis, Plasma, Inferno, Magma, Cividis | Matplotlib’s perceptually-uniform colormaps (Viridis by Stéfan van der Walt & Nathaniel Smith; Cividis by Nuñez, Anderton & Renslow) | CC0 / public domain |
| Coolwarm, Twilight | Matplotlib colormaps (Coolwarm: Kenneth Moreland’s diverging scale; Twilight: van der Walt & Smith) | Matplotlib license / CC0 |
| Jet, HSV, Rainbow, Cool, Hot, Copper, Bone, Pink, Spring, Summer, Autumn, Winter, Prism, Ocean, Terrain, CMRmap, Gist Rainbow, Gist Earth, Gist Stern, Gist Ncar, Nipy Spectral, Cubehelix, Gnuplot, Wistia, Turbo | Classic scientific/MATLAB-style colormaps as shipped in Matplotlib (Turbo by Anton Mikhailov / Google AI; Cubehelix by Dave Green; CMRmap by Carey Rappaport) | Matplotlib license; Turbo is Apache License 2.0 |
| ColorBrewer Set1–3, Paired, Dark2, Accent, Pastel1–2, Spectral, BrBG, PiYG, PRGn, PuOr, RdBu, RdGy, RdYlBu, RdYlGn, Blues, Greens, Oranges, Purples, Reds, BuGn, BuPu, GnBu, OrRd, PuBu, PuBuGn, PuRd, RdPu, YlGn, YlGnBu, YlOrBr, YlOrRd | ColorBrewer by Cynthia Brewer (Penn State) | Apache License 2.0 |
| Seaborn Deep, Muted, Bright, Pastel, Colorblind | Seaborn default qualitative palettes | BSD 3-Clause |
| Solarized | Solarized by Ethan Schoonover | MIT |
| Nord | Nord by Sven Greb | MIT |
| Dracula | Dracula Theme | MIT |
| Material Design | Google Material Design color system | CC BY 4.0 |
| Flat UI | Flat UI Colors | Free to use |
| Okabe-Ito | Okabe & Ito (2008), “Color Universal Design” colorblind-safe palette | Public domain / free to use |
| Mangrove (default), Forest Canopy, Ocean Depth, Sunset Clay, Autumn Harvest, Grayscale, Earth Tones, Pastel Rainbow, Neon Bright, Sunset Gradient, Ice Blues, Berry Mix, Copper & Rust, Royal Jewel Tones, Retro 80s, Monochrome Blue, Corporate Navy & Gold, Slate & Steel, Custom Palette 1–7 | Original combinations created for this project — not derived from an external named scale | — |
Fonts — sources & licensing
Five typefaces are offered for the title/subtitle, chart body/axes/legend,
and the LaTeX/symbol tool. None of the font files themselves are bundled in
this repo — they’re referenced by CSS font-family stacks and resolved
either from Google Fonts (loaded via CDN <link> in index.html) or from
whatever the visitor’s system already has installed, with generic
serif/sans-serif fallbacks either way.
| Font | Source | License |
|---|---|---|
| Poppins | Google Fonts, loaded live from fonts.googleapis.com; designed by Indian Type Foundry | SIL Open Font License 1.1 |
| Cambria | Microsoft ClearType Font Collection (system font — ships with Windows/Office; falls back to Georgia) | Proprietary (Microsoft) — used via system font stack only, not redistributed |
| Times New Roman | Monotype (system font) | Proprietary (Monotype) — used via system font stack only, not redistributed |
| Arial | Monotype (system font) | Proprietary (Monotype) — used via system font stack only, not redistributed |
| Cambria Math | Microsoft (system font — ships with Windows/Office; falls back to STIX Two Math, then Latin Modern Math) | Proprietary (Microsoft); fallbacks STIX Two Math (SIL OFL 1.1) and Latin Modern Math (GUST Font License) |
Because Cambria, Times New Roman, Arial, and Cambria Math are only ever referenced by name in a CSS font stack — never packaged as font files in this repository — a visitor without them installed silently gets the listed fallback (or their browser/OS default serif or sans-serif) instead.
Icons — sources & licensing
Icons across the topbar, sidebar, and Data View ribbon come from a webfont
icon set, Iconify web components, and a few hand-drawn inline SVGs. Nothing
here is bundled as a font/icon file in the repo — Material Symbols loads live
from Google Fonts, Iconify icons are fetched on demand by the
iconify-icon component, and the custom SVGs are written directly in
index.html.
| Icon set | Used for | Source | License |
|---|---|---|---|
| Material Symbols (Rounded) | The large majority of toolbar, sidebar, and ribbon icons | Google Fonts Icons, loaded live via CDN <link> | Apache License 2.0 |
| Custom inline SVG | Chart-type thumbnails, draw-tool shape picker, sidebar nav marks, and export-format icons not covered by Material Symbols | Original artwork drawn for this project | Project license (MIT) |
Iconify — Material Design Icons (mdi:) | Chart-type tiles in the Chart panel (loaded via the iconify-icon web component) | Iconify (aggregator — icon | Apache License 2.0 (Material Design Icons); confirm per set before adding others |
Page templates
| Template | Size | Unit |
|---|---|---|
| A4 Landscape | 297 × 210 | mm |
| A4 Portrait | 210 × 297 | mm |
| Letter Landscape | 279.4 × 215.9 | mm |
| Letter Portrait | 215.9 × 279.4 | mm |
| Legal Landscape | 355.6 × 215.9 | mm |
| Legal Portrait | 215.9 × 355.6 | mm |
| Presentation 16:9 | 1920 × 1080 | px |
| Presentation 4:3 | 1024 × 768 | px |
| Instagram Story | 1080 × 1920 | px |
| Social Square | 1080 × 1080 | px |
Custom width/height is also available in px, mm, or cm, independent of the templates above.
Fill patterns, dash styles & data-point markers
8 fill/hatch patterns (drawn as SVG patterns by the D3 engine — used whenever a series’ style includes patterns): solid, / diagonal, \ diagonal, x cross, - horizontal lines, | vertical lines, + cross, . dots.
6 line dash styles: solid, dot, dash, longdash, dashdot, longdashdot.
21 data-point marker shapes for line, area, and scatter charts (drives both the plotted marker and its legend icon): Circle, Square, Diamond, Triangle up, Triangle down, Pentagon, Hexagon, Star, Star diamond, Star triangle, Hexagram, Plus (+), X, Hash (#), Asterisk (*), Arrow, Y, Hourglass, Bowtie, Diamond tall, Diamond wide.
Layout shape library
Beyond text boxes, the Layout canvas’s Shapes panel offers 30 drawable shapes across four groups, each editable from its floating bar and the Design panel (fill or gradient, stroke, corner radius, shadow):
Basic shapes (14): square, rectangle, rounded rectangle, circle, ellipse, triangle, inverted triangle, right triangle, diamond, parallelogram, trapezoid, pentagon, hexagon, octagon
Lines & arrows (8): line, dashed line, arrow right, arrow left, arrow up, arrow down, double arrow, chevron
Stars (4): 4-point, 5-point, 6-point, 8-point
Symbols (4): cross/plus, heart, speech bubble, half circle
Export details
PNG/JPG are rendered from the chart’s SVG, scaled from a 96 DPI baseline — 75/100/300/600 DPI map to a
scalefactor ofdpi / 96(≈0.78×, 1.04×, 3.125×, 6.25×) applied to the full-page canvas size, so a 1920×1080 px page exports at 6000×3375 at 300 DPI. The file name is set in the Export panel (defaultlayout).PNG, JPG and PDF are a full-page composite: background, chart, and every layout object (text, shapes, images, drawings, LaTeX formulas) flattened together exactly as shown in the editor. Vector PDF keeps the chart as vector graphics (jsPDF + svg2pdf); the flattened mode embeds a raster image.
SVG export covers the chart only (the chart’s own D3 SVG) — it does not include layout objects, text, or LaTeX formulas sitting on the canvas around it.
Background: Canvas color, White, or Transparent (JPG has no alpha channel, so transparent becomes white).
Value label formatting
| Option | Example (1234.5) |
|---|---|
| Auto | 1234.5 (rounded to 2 decimals, trailing zeros trimmed) |
| Integer | 1235 |
| 1 decimal | 1234.5 |
| 2 decimals | 1234.50 |
| Thousands separator | 1,235 |
| Percent | 1234.5% |
| Currency | Rp 1,235 (Indonesian Rupiah formatting, locale id-ID) |
Error bars
Applied to every visible series on bar, line, area, and scatter charts (not available on pie/donut/heatmap/box/violin/waterfall/funnel/treemap). Two modes:
Percent-of-value: the bar length is
|value × (percent / 100)|— so a 10% setting on a value of 200 draws a ±20 error bar.Fixed-amount: every point gets the same bar length regardless of its value.
Cap width and line thickness are independently adjustable, and the error bar color can either stay black (default, matching print conventions) or follow each series’ own color.
Keyboard shortcuts
| Shortcut | Action |
|---|---|
| Ctrl+Z / Ctrl+Y (or Ctrl+Shift+Z) | Undo / redo |
| Ctrl + / Ctrl − / Ctrl 0 | Zoom in / zoom out / zoom to 100% |
| Mouse wheel | Zoom around the pointer (Shift: pan sideways, Alt: pan up/down) |
| Ctrl+B / Ctrl+I / Ctrl+U | Bold / italic / underline (text selected) |
| Delete or Backspace | Remove the selected layout object |
| Ctrl+C (Data View) | Copy the selected cells |
| Enter / double-click (Pen tool) | Finish the path; Backspace removes the last point, Esc leaves the tool |
| Double-click the map | Move the map content (Pan / Select / Identify); Esc or Done to leave |
| Shift + click (map Select tool) | Add to or remove from the selection |
Duplicate, lock, arrange and delete are also on the floating object bar and the right-click menu.
Libraries & versions
| Library | Version | Loaded from |
|---|---|---|
| D3.js | bundled (v7.9.0, ISC) | local file (vendor/d3-7.9.0.min.js), not CDN |
| Fabric.js | 5.3.0 | cdnjs |
| MathJax | 3.2.2 (es5/tex-svg.js) | cdnjs |
| math.js | 12.4.3 | cdnjs — expression evaluation in Data View formulas |
| Papa Parse | 5.4.1 | cdnjs |
| SheetJS (xlsx) | 0.18.5 | cdnjs — Excel .xlsx/.xls import |
| AG Grid Community | 35.3.0 | cdnjs |
| marked | 16.3.0 | cdnjs — renders this README as HTML on the splash screen |
| jsPDF | 2.5.1 | cdnjs — PDF export |
| svg2pdf.js | 2.2.3 | jsDelivr — vector charts in PDF export |
| iconify-icon | 2.1.0 | code.iconify.design — chart-type icons |
| MapLibre GL JS | 5.9.0 | cdnjs — the map workspace (loaded when a map is opened) |
| geotiff.js | 2.1.3 | jsDelivr — GeoTIFF raster layers (loaded on first raster) |
Known limitations
Click to expand — 7 known limitations
Built with
This project only exists because of the following open-source libraries and free services — a genuine thank-you to everyone who builds and maintains them:
D3.js — the charting engine behind every chart type (scales, axes, shapes, layouts, d3-geo maps) and the SVG/PNG rendering itself
Fabric.js — powers the full-page layout editor: draggable/resizable text, shapes, and the LaTeX objects that sit on top of the chart
MathJax — renders LaTeX (
$...$) typed into the formula tool as real typeset math, live, on the canvasmath.js — evaluates expressions in Data View formulas
Papa Parse — makes CSV/TSV import reliable, even with messy real-world data (quoted fields, embedded commas, escaped quotes)
SheetJS — reads Excel
.xlsx/.xlsfiles (including multi-sheet workbooks) directly in the browserMapLibre GL JS — renders the map workspace: vector and raster layers, basemaps, rotation and export
geotiff.js — reads GeoTIFF rasters in the browser
OpenFreeMap, OpenStreetMap, CARTO, Esri and OpenTopoMap — basemap tiles (attribution is drawn on every map)
AG Grid (Community edition) — the editable spreadsheet-style table behind the Data View
marked — renders this README as HTML on the app’s splash screen
jsPDF and svg2pdf.js — PDF export, with the chart kept as vector graphics
Google Fonts — serves the typography options used throughout the app
Material Symbols — the icon set used across the toolbar and sidebar
Iconify — the chart-type icons (Material Design Icons)
GitHub Pages — hosts this app for free, straight from the repository, with no server to maintain
cdnjs / Cloudflare — serves every CDN-loaded library above reliably to every visitor
Shields.io — the badges at the top of this README
Everyone who opened an issue, suggested a feature, or gave feedback on the UI — this tool is better because of that input, and it’s still very much a work in progress
License
Released under the MIT License. Bundled third-party code
(vendor/d3-7.9.0.min.js, ISC) keeps its own notice — see
THIRD
Purpose & Acknowledgements
This project was not built to compete with established data visualization software or commercial charting tools. Rather, its core purpose is simply to utilize available open-source technologies to make the process of creating publication-ready plots as easy, accessible, and lightweight as possible. It is especially dedicated to students and researchers who might not have coding experience or the budget to access premium software, with the hope that the features provided here can assist in their research and academic work.
Ploots Click draws heavy inspiration from the many incredible charting tools, design systems, and data communities out there. A massive thank you to all the creators of the underlying engines and open-source libraries that power this tool. A special thanks to GitHub for providing GitHub Pages, which makes hosting this static web app for free possible.
I am always open to feedback and suggestions. Ultimately, I am just a student utilizing a little bit of knowledge with the help of official documentation and AI tools like Claude, ChatGPT (for brainstorming), and Gemini to help bring this idea to life. To every developer, library maintainer, and supporter—thank you. This tool is built on the shoulders of your hard work.
Feedback & Contributions
Since I am always open to feedback and suggestions, if you find a bug, have a feature request, or just want to share how you use Ploots Click in your research, please feel free to open an Issue in this repository.
You don’t need to be a programmer to contribute—bug reports, design ideas, and usability feedback are incredibly valuable!
Author
Built by Defani Arman Alfitriansyah.